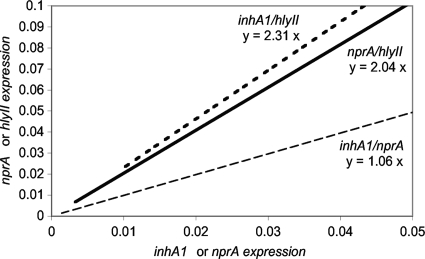
FIG. 2.
Relative expression profiles. For each strain, the inhA1 (x axis) expression value was plotted against the nprA (y axis, gray dashed line) or the hlyII (dark dashed line) expression value. Alternatively, nprA expression values (x axis) were plotted against the hlyII values (y axis, plain line). The regression line was drawn, and the average ratio between expression values was calculated.

