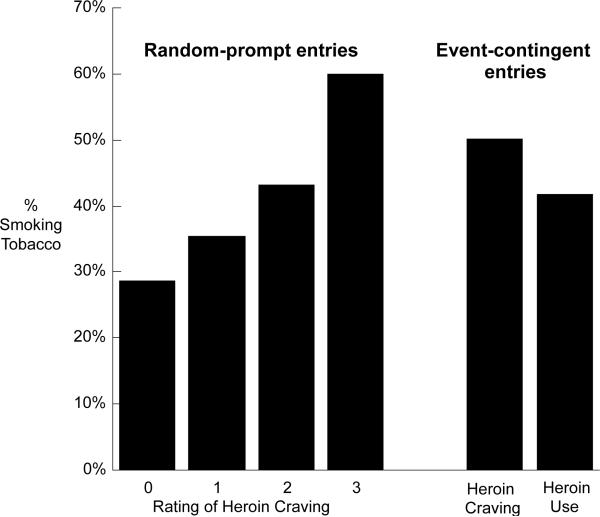
Fig. 3.
Four left columns: Percentage of random prompts at which participants reported smoking tobacco, by degree of reported heroin craving. Two right columns: Percentage of event-contingent prompts at which participants reported smoking tobacco. The denominators for the six bars were: 15,098 (heroin craving rated 0); 7,647 (heroin craving rated 1); 966 (heroin craving rated 2); 1,103 (heroin craving rated 3); 257 (event-contingent heroin-craving entry); 60 (event-contingent heroin-use entry). The bars show raw percentages, whereas the statistical results are adjusted for sex, race, age, and location. The pattern of covariate-adjusted percentages (not shown) was similar to the pattern of raw percentages.

