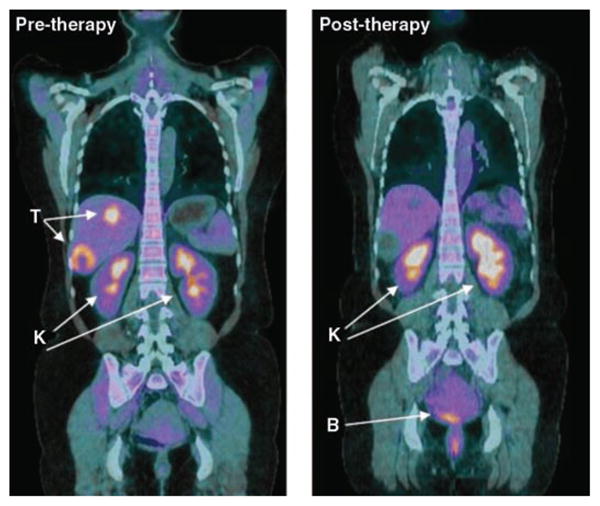
Fig. 4.

Decreased metabolism of glucose by tumors, visualized by PET with the glucose analog FDG, predicts response to anticancer therapy. Shown are fused coronal images of FDG-PET and computerized tomography (CT) obtained on a hybrid PET/CT scanner after the infusion of FDG in a patient with a form of malignant sarcoma (gastrointestinal stromal tumor) before and after therapy with a tyrosine kinase inhibitor (sunitinib). The tumor (T) is readily visualized by FDG-PET/CT before therapy (left). After 4 weeks of therapy (right), the tumor shows no uptake of FDG despite persistent abnormalities on CT. Excess FDG is excreted in the urine, and therefore the kidneys (K) and bladder (B) are also visualized as labeled. [Image courtesy of A. D. Van den Abbeele, Dana-Farber Cancer Institute, Boston]
