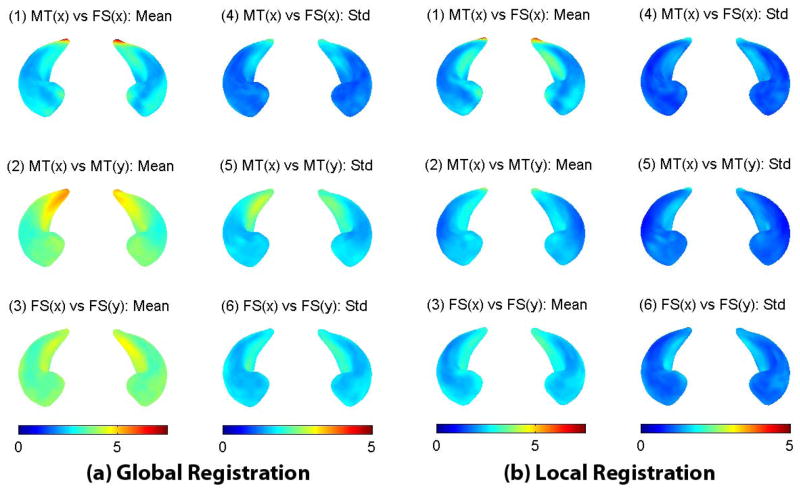
Fig. 7.
Statistical maps of intra-subject and inter-subject surface distances after (a) global registration or (b) local registration. In each of (a) and (b), the left column shows the mean map, and the right column shows the standard deviation map. Shown in the top row are intra-subject distances between the MT and FS methods, in the middle row inter-subject distances within the MT data, and in the bottom row inter-subject distances within the FS data. All the mean and standard deviation maps are color-coded and superimposed onto the hippocampal atlas.

