
Figure 1.
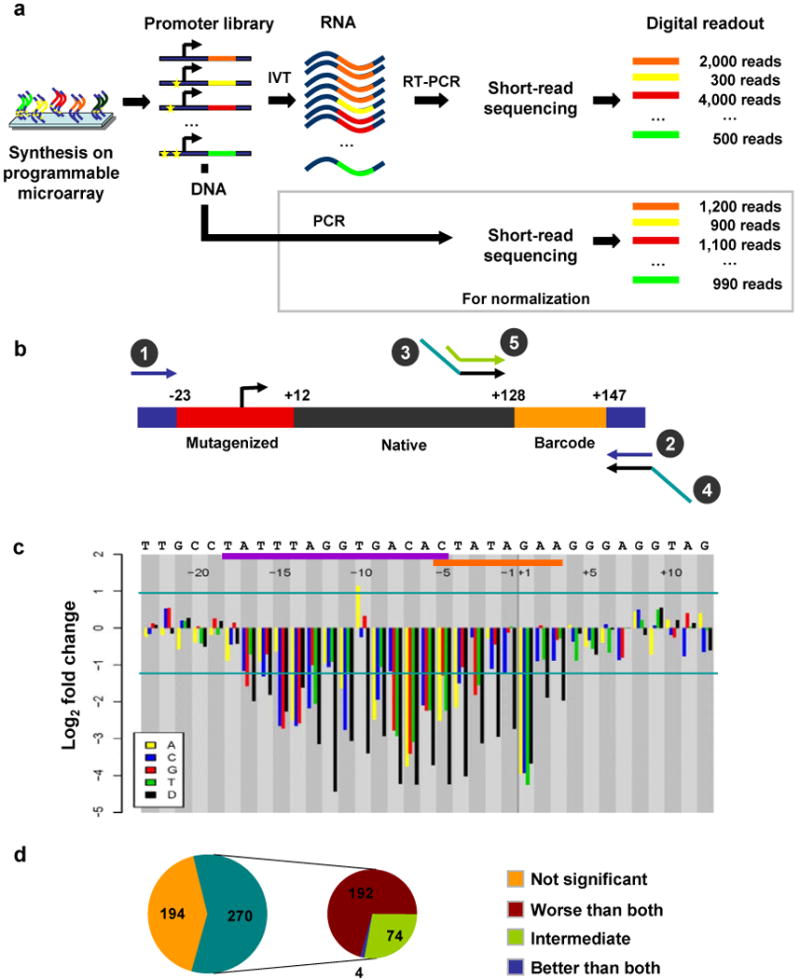
Synthetic saturation mutagenesis of a bacteriophage promoter. (a) Promoter templates are synthesized on a programmable microarray, released into solution and amplified by PCR (primers 1 and 2 in b). One fraction of the amplified promoter library is subjected to in vitro transcription followed by reverse transcription PCR (primers 3 and 4 in b). Another fraction is simply PCR amplified using the same primers. Barcodes within RNA- and DNA-derived amplicons are sequenced separately (primer 5 in b). RNA-derived barcode counts provide a digital readout of the transcriptional efficiency of associated promoters. DNA-derived barcode counts are used to normalize for any nonuniformity in the initial oligonucleotide concentrations. (b) For bacteriophage promoters, each 200-nt oligonucleotide consists of the promoter (red), 115-nt of the native downstream sequence (black), a variable 20-nt barcode sequence (orange) and 15-nt PCR primers (blue) on either side. (c) Changes in transcriptional efficiency (average of six barcodes) for each single-nucleotide substitution or deletion (D) relative to the native promoter for bacteriophage promoter SP6. Horizontal lines mark significance cutoffs (P < 0.01). Horizontal axis denotes the position of the mutation relative to TSS, from −23 to +12, with naive nucleotides specified above. Polymerase binding (purple bar) and melting/initiation (orange bar) regions are also indicated above. (d) Classification of SP6 double-mutant templates based on their effect on transcription. The templates where either the double mutant or at least one of the corresponding single mutants have a significant effect on transcription relative to the native promoter are further classified based on the effect of the double mutant as compared to the two single mutants.