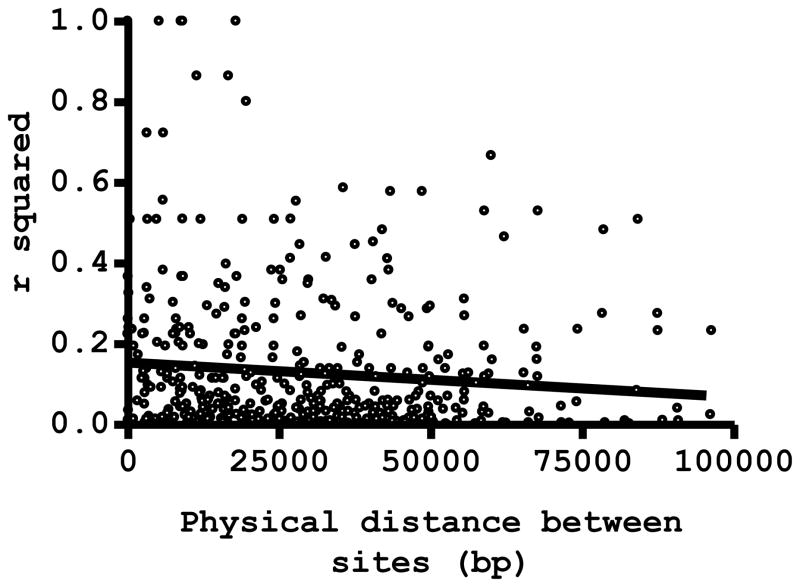
Figure 4.
Linkage disequilibrium (LD) decay with increasing physical distance between pairs of variable sites along chromosome 8 of Plasmodium vivax collected in Acre, Brazil. The LD index r2 was calculated for 465 pairwise comparisons. Circles represent individual r2 values, which are shown to decrease slowly but significantly (P = 0.031) with increasing physical distance (measured in bp) between SNP sites; the Pearson linear correlation coefficient r is 0.100, with a slope of −9 × 10⁻⁷ of the regression line shown in the figure.

