
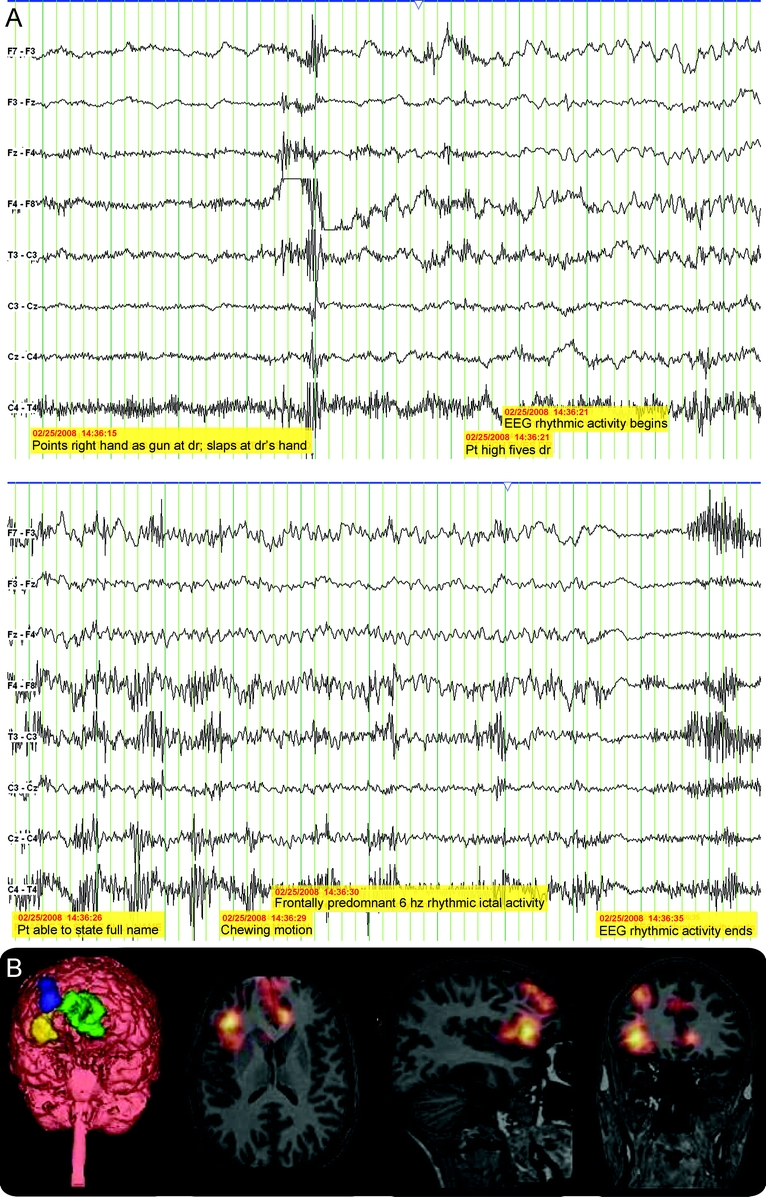
Figure Ictal EEG and ictal SPECT results
(A) The electrographic ictal changes on a condensed transverse montage during a seizure. (B) Ictal SPECT showed focal regions of hyperperfusion in the right lateral and orbitofrontal cortex and left medial frontal cortex. Ictal SPECT scan performed using Technitium-99 and superimposed upon interictal SPECT scan and coregistered to MRI (SISCOM).