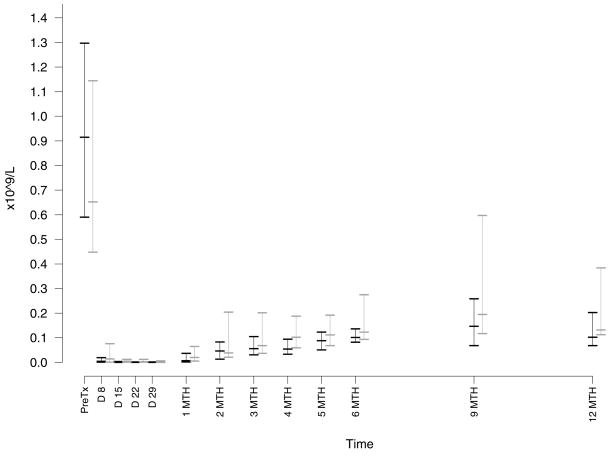
Figure 2. Effect of Treatment on T Lymphocytes.
The CD4+ (black data points) and CD8+ (gray data points) T lymphocyte subsets counts were calculated from the absolute lymphocyte count and flow cytometric analysis for expression of CD3, CD4, and CD8. The median nadir count for CD4+ T cells was 0.0001 × 10⁹/L (range 0 – 0.0034) and for CD8+ T cells was 0.0003 × 10⁹/L (range 0 – 0.032).

