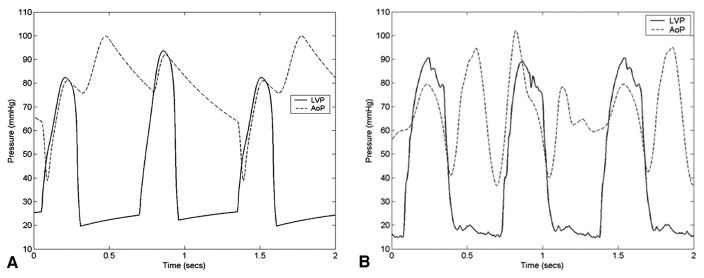
Figure 9.
Comparison of the LV pressure (LVP) and the aortic pressure (AoP) waveforms obtained from the computer simulation and mock circulation models show the similarity in the hemodynamic waveform morphology. Differences in waveform morphology can be attributed to slight deviations in CPD timing associated with performance limitations of our CPD driver.

