
Fig. 4. Reduced mitochondrial membrane potential from PGC-1α knockdown.
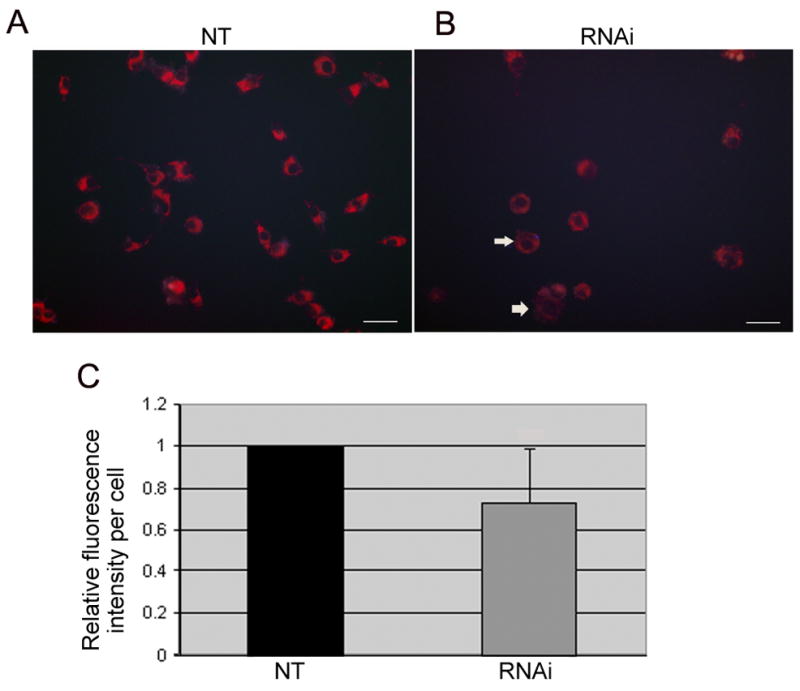
We used MitoTracker Red CMXRos to probe the 3D5 cultures for the change in mitochondrial membrane potential (MMP) subsequent to their RNAi treatments. (A) Bright red fluorescent signal indicative of roboust MMP was demonstrated in the non-target controls (NT). (B) In contrast, the fluorescent intensity appeared much lower in the RNAi-treated (arrows) suggesting compromised MMP. Quantitative analysis of the 3D5 cells using the MCID imaging software revealed that PGC-1α knockdown leads to a significant reduction in MitoTracker fluorescence (P=0.0003, n=165 cells) in contrast with that of the NT-control (n=308 cells). Values are presented as means ± SD.