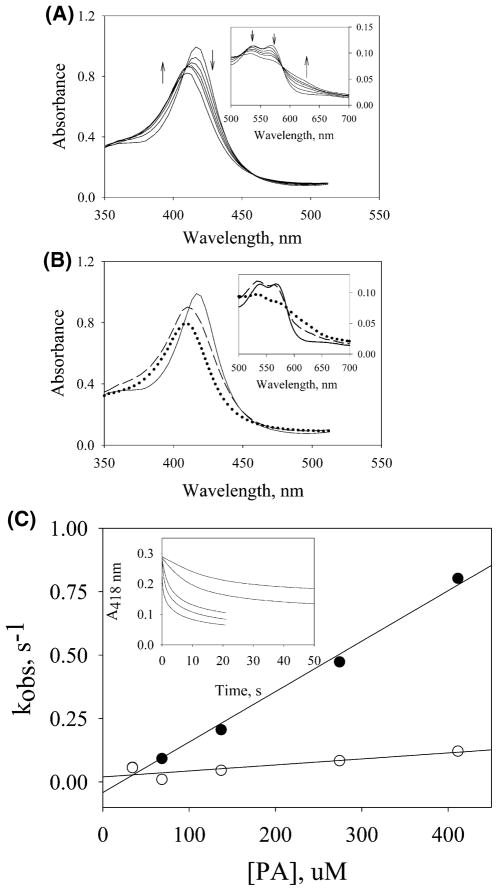
Figure 1.
Stopped-flow experiments of the reaction of PGIS (110 μM) with PA (1.1 mM) at 23 °C using a 2 mm light path. (A) Rapid-scan spectra were recorded at 0.0013, 0.129, 0.257, 0.385, 0.513, and 1.0 s after mixing. Arrows indicate the direction of spectral changes with increasing time. Inset: Eexpansion of data in the visible region. (B) Spectral intermediates were resolved by a two-step model A → B → C using ProK analysis. The spectrum for species A is shown with a solid line, B with a dashed line, and C with a dotted line in the Soret region and the visible region (inset). (C) Secondary plots of the observed rates determined at 418 nm versus PA concentration were analyzed for the first phase (filled circles) and the second phase (open circles). The inset shows the kinetic traces for reactions of PGIS with 35 (top), 70, 140, 280, and 420 (bottom) μM PA.

