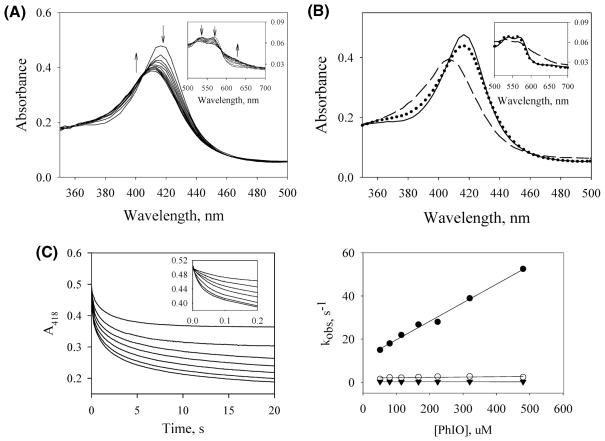
Figure 2.
Stopped-flow experiments of the reaction of PGIS (10 μM) with PhIO (250 μM) at 23 °C using a 1 cm light path. (A) Rapid-scan spectra were recorded at 0.0013, 0.104, 0.206, 0.308, 0.411, 0.513, 0.616, 0.718, 0.821, 0.923, and 1.02 s. Arrows indicate the direction of spectral changes with increasing time. (B) Spectral intermediates A′ (solid line), B′ (dotted line), and C′ (dashed line) were resolved by a two-step model A′ → B′ → C′ over 0.5 s reaction using global analysis. (C) Left panel: Time courses of PGIS reacted with 51 (top), 80, 115, 166, 224, 320, and 480 (bottom) μM PhIO. The kinetic traces of the initial 0.2 s are shown in the inset. Right panel: Secondary plots of the observed rates determined at 418 nm versus PhIO concentration are shown for the first phase (filled circles), the second phase (open circles), and the third phase (filled triangles).

