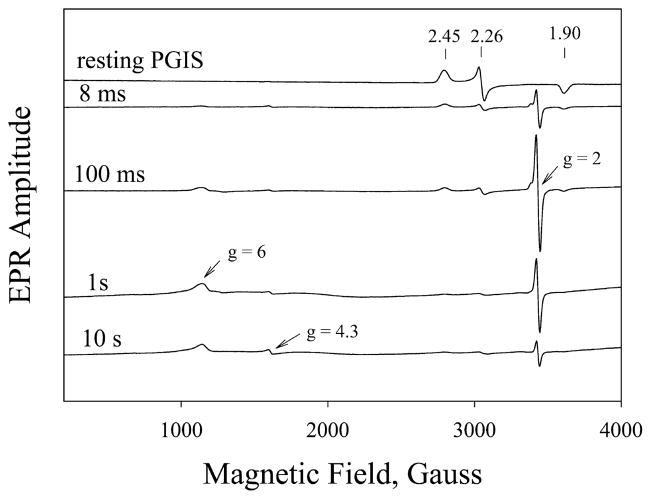
Figure 3.
X-band EPR spectra of the reaction of PGIS with PA. Resting PGIS (150 μM manually mixed with 4 volumes of NaPi buffer) or samples collected after PGIS (150 μM) was mixed with PA (1.5 mM) for 8 ms, 100 ms, 1 s, and 10 s. EPR conditions were microwave power, 4 mW; microwave frequency, 9.6 GHz; modulation amplitude, 10.87 G; and temperature, 10 K. Numbers above the vertical arrows are the g values of the rhombic low-spin heme center.

