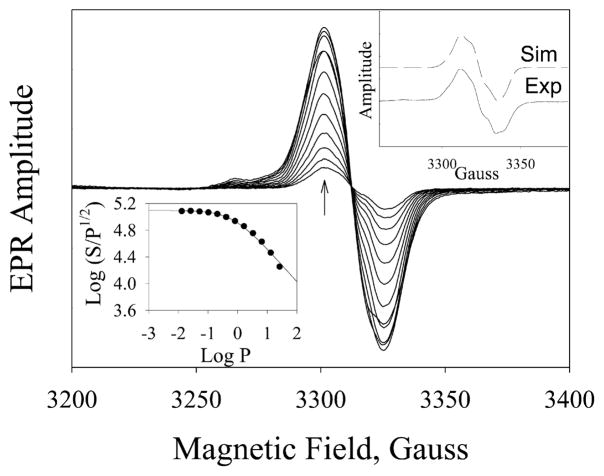
Figure 4.
Progressive EPR power saturation for the radical intermediate trapped at 100 ms reaction of PGIS (150 μM) with PA (1.5 mM). EPR parameters were microwave power, 12.9 μW–25.8 mW; microwave frequency, 9.3 GHz; modulation amplitude, 2 G; and temperature, 110 K. Arrow indicates the direction of increasing microwave power. Lower left inset: microwave saturation curve of the g = 2 radical. The P1/2 value, fitted by eq 2 in which b was given as 1, is 0.73 mW. Upper right inset: Experimental (solid line) and simulated (dashed line; using the parameters in Table 2) X-band spectra of the freeze-quenched sample collected by reaction of 700 μM PGIS with 7 mM PA for 25 ms. Microwave power, 0.1 mW; microwave frequency, 9.3 GHz; modulation amplitude, 1 G; and temperature, 110 K.

