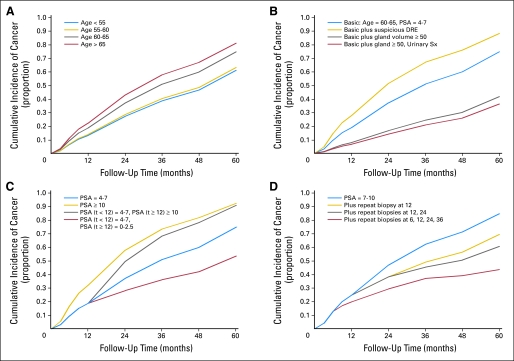
Fig 2.
Cumulative incidence of prostate cancer with varying (A) age; (B) digital rectal examination (DRE), gland volume, and urinary symptoms (Sx); (C) prostate-specific antigen (PSA); and (D) number of negative biopsies. Each graph includes a basic event history curve shown with a blue line and alternative histories are shown with gold, gray, and red lines. All covariates not mentioned are set to reference levels as in Table 2. Note the small effect of age and DRE relative to PSA and gland volume and that for men with persistent PSA of 7 to 10 ng/mL, risk remains elevated after several negative biopsies.

