
FIG. 3.
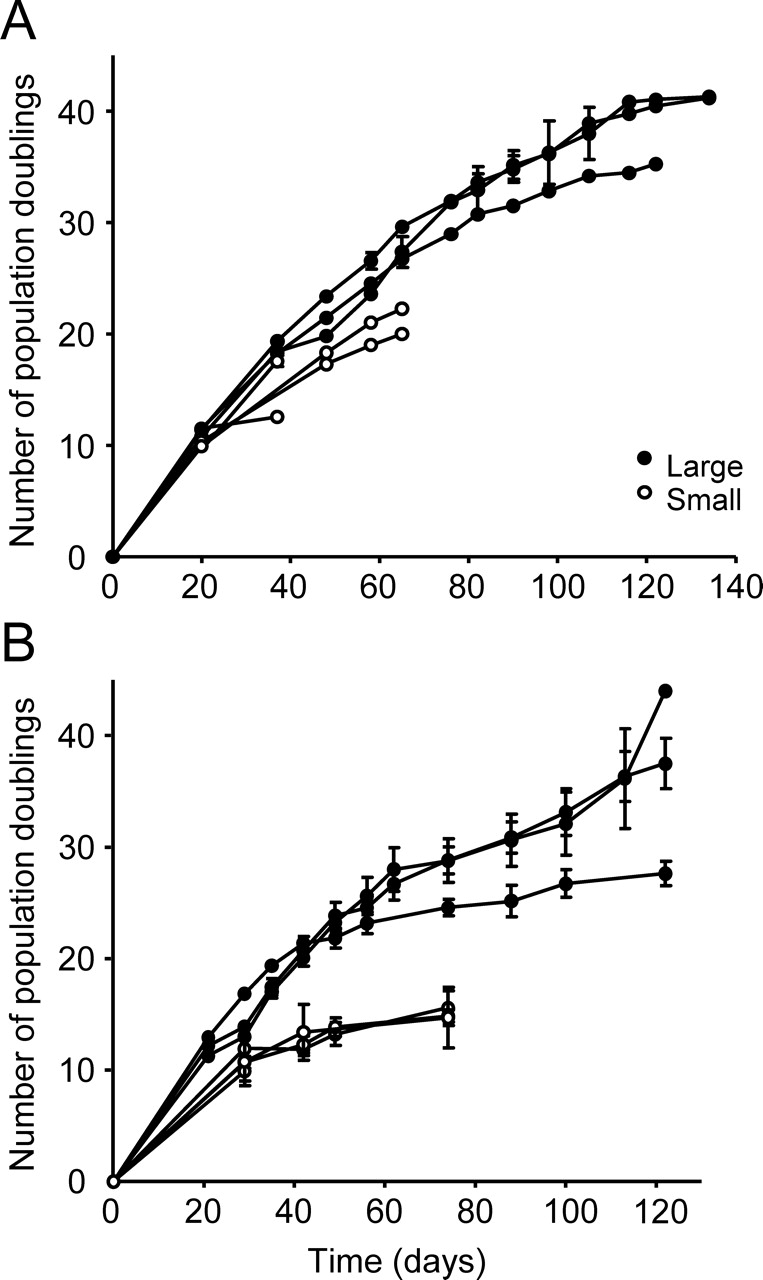
Proliferative potential of human endometrial large and small epithelial and stromal CFU. Growth curves from single primary large and small epithelial (A) and stromal (B) CFU from individual patient samples passaged at 2000 cells/cm2 illustrating differences in cell proliferation rates and total cell output. Each curve is the mean ± SEM of n = 3–5 clones derived from an individual patient sample (n = 3 patients, nos. 10, 12, and 13 for epithelial; n = 4 patients, nos. 1–4 for stromal).