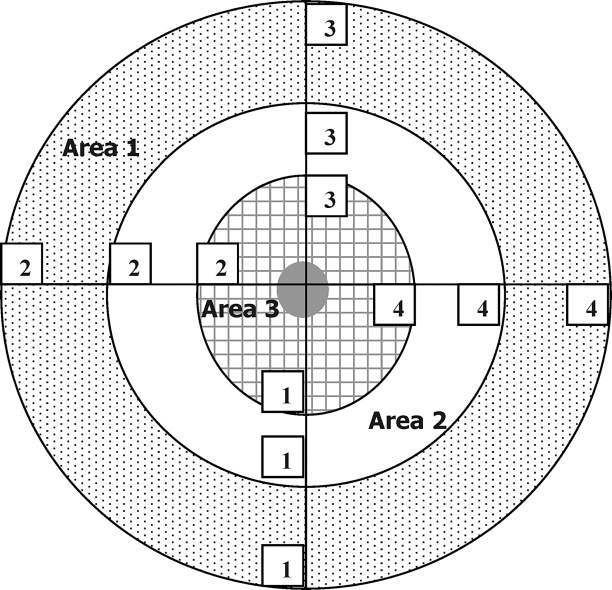
FIG. 1.
Template for analysis of fluorescently labeled embryos imaged using confocal microscopy. Figure represents one of the cells of a 2-cell embryo and is repeated for the other cell. Area 1 = outer area, Area 2 = intermediate area, and Area 3 = perinuclear area. Numbers 1–4 in the cell where fluorescence readings were taken.

