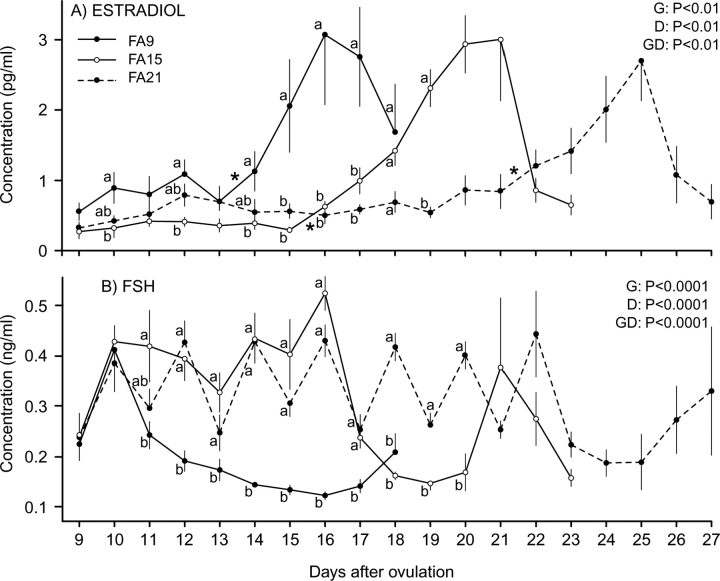
FIG. 3.
Mean (±SEM) plasma E2 concentrations (A) and plasma FSH concentrations (B) during luteolysis in heifers in which all follicles ≥4 mm were ablated once on Day 9 (FA9; n = 6); ablated every 2 days from Day 9 to Day 15 (FA15; n = 6); or ablated every 2 days from Day 9 to Day 21 (FA21; n = 7). Main effects of group (G), day (D), and their interaction (GD) are shown. Different lowercase letters (a and b) indicate differences (P < 0.05) among groups within a time period. An asterisk (*) indicates the first significant increase in plasma E2 concentration between 2 days.

