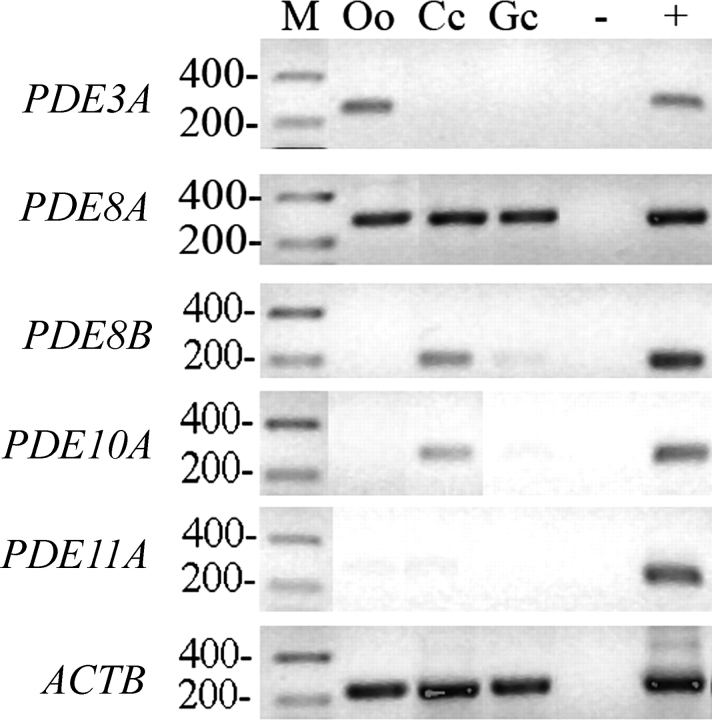
FIG. 4.
Detection of PDE3A, PDE8A, PDE8B, PDE10A, PDE11A, and ACTB expression by RT-PCR in the various compartments of the ovarian follicle. For each gel, a molecular mass marker (M) was run with the samples, with the corresponding molecular weight (in base pairs) noted on the left. PDE genes were amplified from oocyte (Oo), cumulus (Cc), and granulosa cell (Gc) cDNA, along with a no-template negative control (−) and a mouse mammary gland positive control (+). A representative experiment of three replicates is shown.

