FIG. 5.

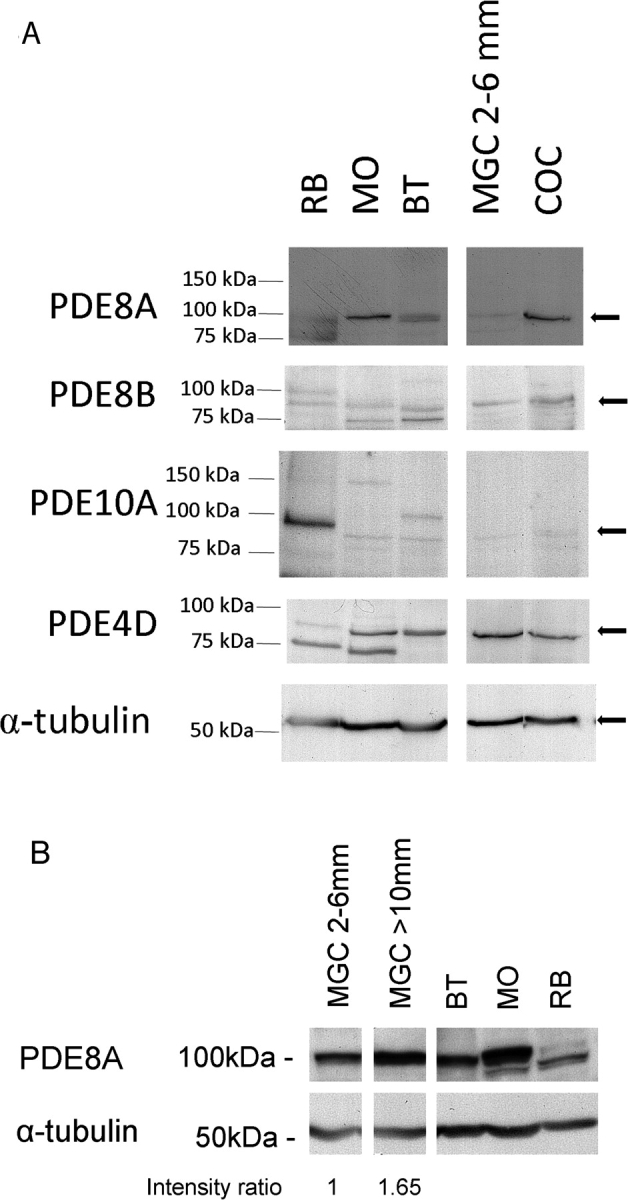
Immunoblot detection of PDE8A, PDE8B, PDE10A, PDE4D, and α-tubulin in granulosa cells and COCs. A) The expression of various PDEs was determined by immunodetection. Protein samples were run on SDS-PAGE and hybridized with specific PDE antibodies. For each gel, a molecular mass ladder was run with the samples, and band positions are displayed on the left in kiloDaltons. Samples are rat brain (RB), mouse ovary (MO), bovine testis (BT), mural granulosa cells (MGC) from 2- to 6-mm follicles, and COCs. B) Comparative expression of PDE8A between granulosa cells from 2- to 6-mm follicles and follicles larger than 10 mm. PDE8A and α-tubulin intensities were quantified by ImageJ software (National Institutes of Health) from two separate experiments. The intensity ratio presented below the figure is expressed as the mean ratio between PDE8A and α-tubulin.
