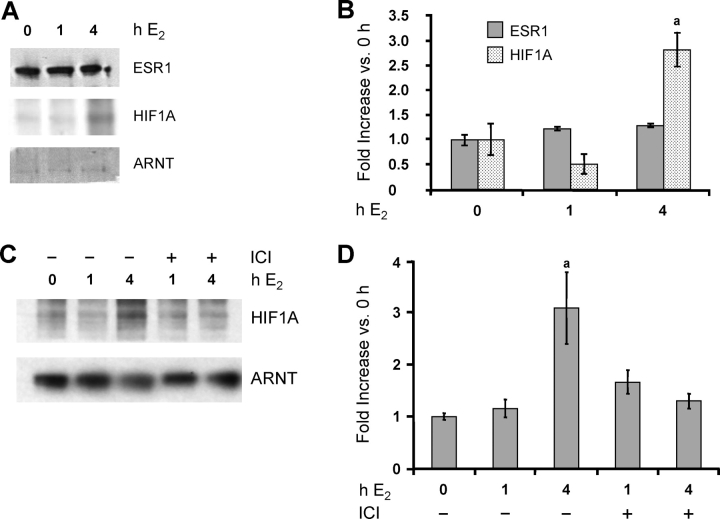
FIG. 4.
A and B) E2 induces HIF1A expression in LE cells. Rats were treated as described in Figure 1. Total protein was extracted from LE cells, and ESR1, HIF1A, and ARNT proteins were analyzed by Western blot analysis (representative gels [A] and densitometry [B]). Densitometry results are expressed as the fold increase in each protein compared with cells not exposed to E2 (0-h E2) after normalization to ARNT (mean ± SEM, n = 3 LE cell samples/group). a, vs. 0 h and 1-h E2 (P < 0.01). C and D) The E2 induction of HIF1A expression in the uterus is blocked by ICI 182,780. Rats were treated as described in Figure 3. Total protein was extracted from whole uteri, and HIF1A and ARNT proteins were analyzed by Western blot analysis (representative gels [C] and densitometry [D]). Densitometry results are expressed as the fold increase in HIF1A compared with uteri not exposed to either ICI or E2 (0 h) after normalization to ARNT (mean ± SEM, n = 3–4 uteri/group). a, vs. 0 h, 1-h E2, ICI 1-h E2, and ICI 4-h E2 (P < 0.01).

