FIG. 5.
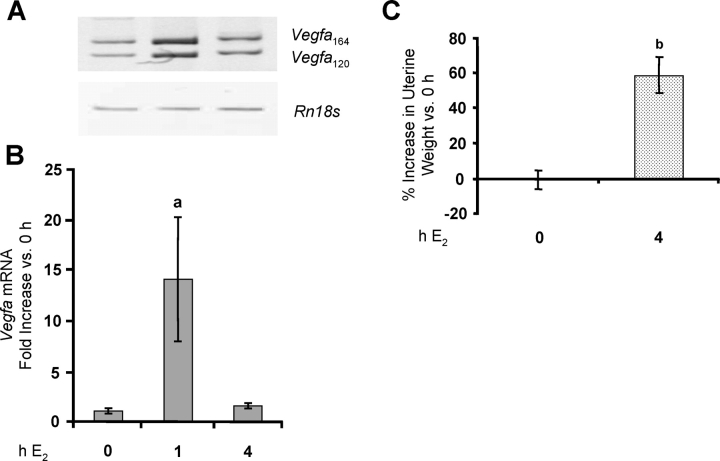
E2 induces Vegfa expression in endometrial LE cells. Rats were treated as described in Figure 1. Total RNA was extracted from LE cells, and Vegfa mRNA was analyzed by conventional (A) and real-time (B) RT-PCR. Real-time results are expressed as the fold increase in Vegfa mRNA levels compared with untreated controls (0 h) after normalization to Rn18s (mean ± SEM, n = 3 LE cell samples/group). a, vs. 0 h and 4 h E2 (P < 0.05). C) Uteri were weighed before LE cell isolation, and the percentage increase in wet weight (normalized to body weight) vs. 0 h is given (mean ± SEM, n = 6 uteri/group). b, vs. 0 h (P < 0.001).

