Fig. 4.

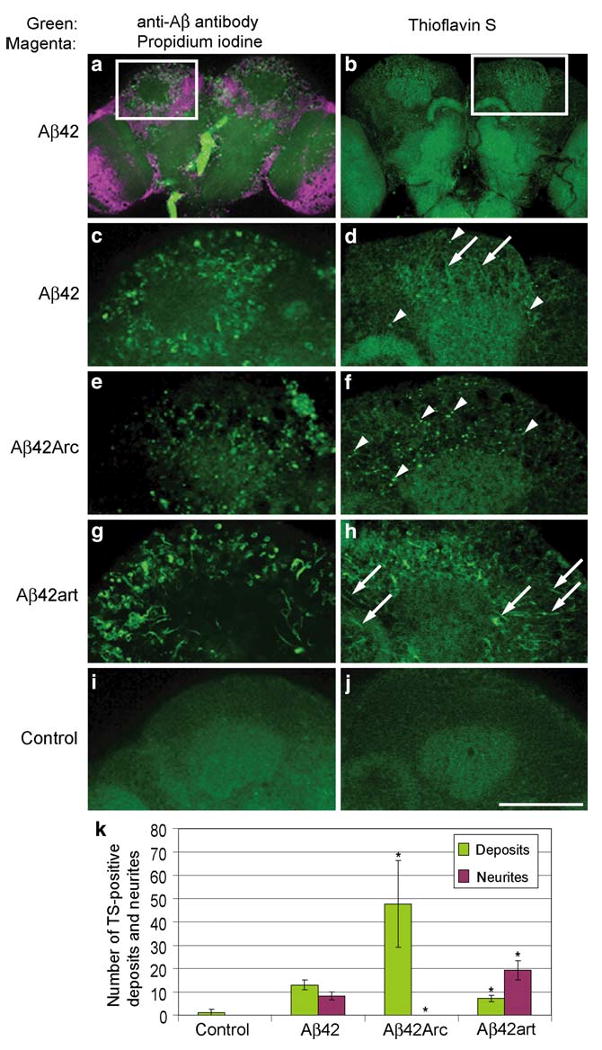
Distribution and aggregation of Aβ42, Aβ42Arc, and Aβ42art peptides in fly brains. a, c, e, g and i, Immunostaining of brains of 25 day-old flies with anti-Aβ antibody (green). In a, nuclei were stained with propidium iodide (magenta). b, d, f, h and j, Thioflavin S (TS) staining of brains of 25 day-old flies. Arrowheads and arrows indicate TS-positive deposits and neurites, respectively. No signal was detected in the control i, j. Scale bar in j: 50 μm. c and d are enlarged images of the boxed regions in a and b, respectively. k Numbers of TS-positive deposits and neurites were presented as averages ± SD (n = 6 hemispheres). Asterisks indicate significant differences from Aβ42 (P < 0.05, Student's t test). Adapted from PLoS One, (Iijima et al. 2008)
