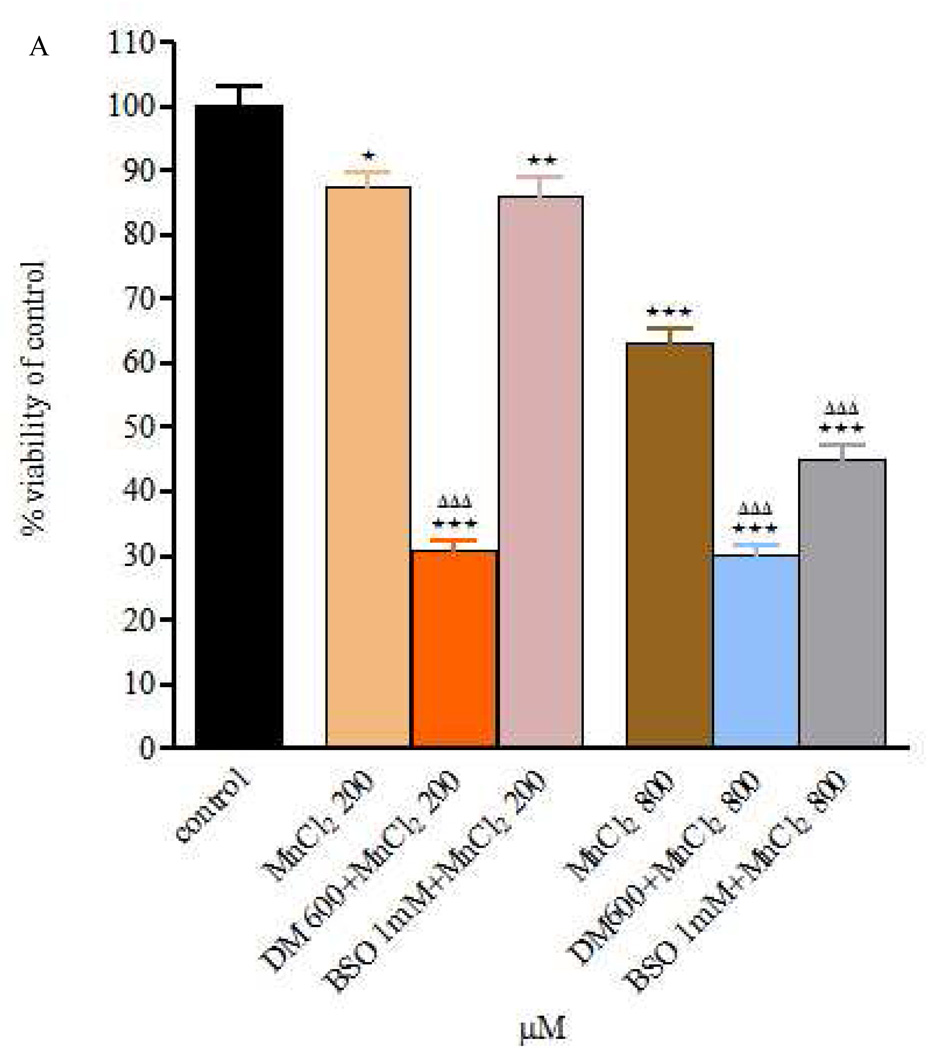
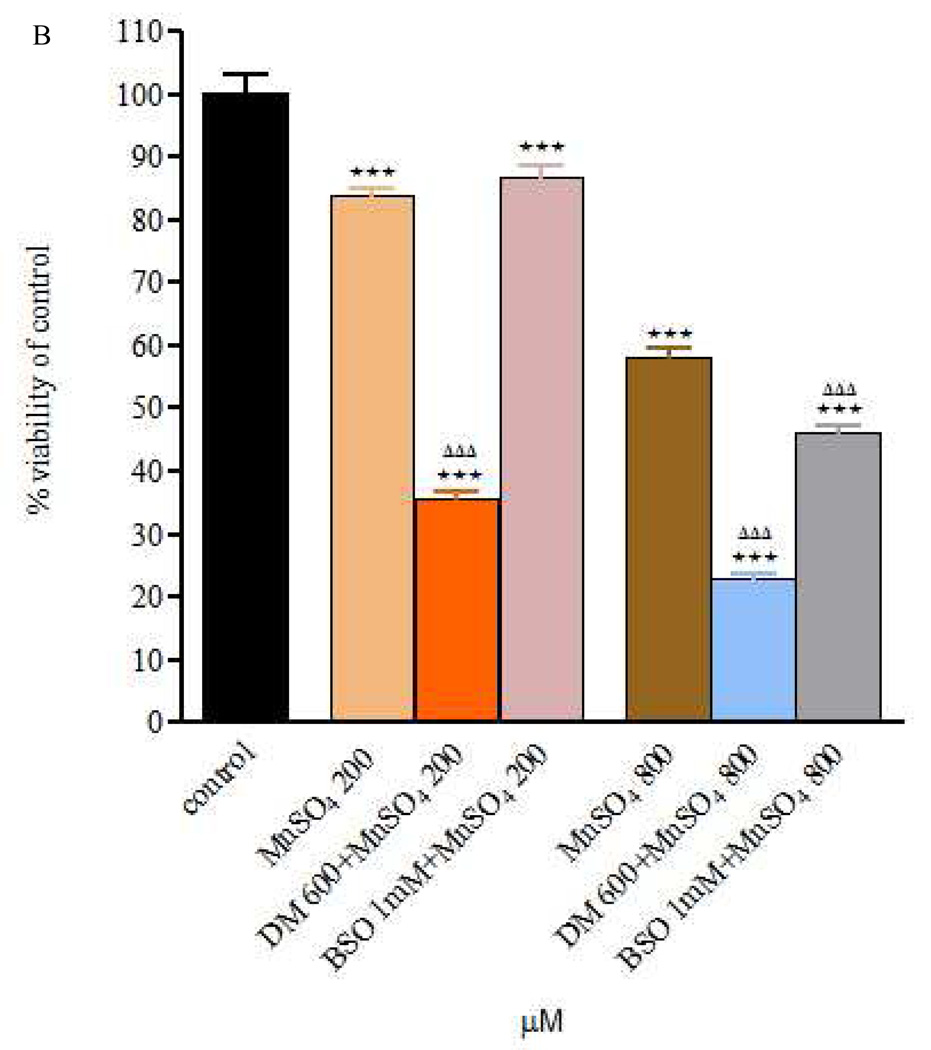
Figure 2.
Figure 2 A and B – Viability of RBE4 cells exposed to MnCl2 or MnSO4 during 24h (200 and 800 µM), after a 24h DEM 600 µM and BSO 1mM treatment. Values are expressed as means ± SEM from 3 independent experiments. * p< 0.05, ** p< 0.01, *** p< 0.001 compared to control; ΔΔΔ p< 0.001 compared to Mn 200 in Mn 200 µM group or Mn 800 in Mn 800 µM group, respectively.


