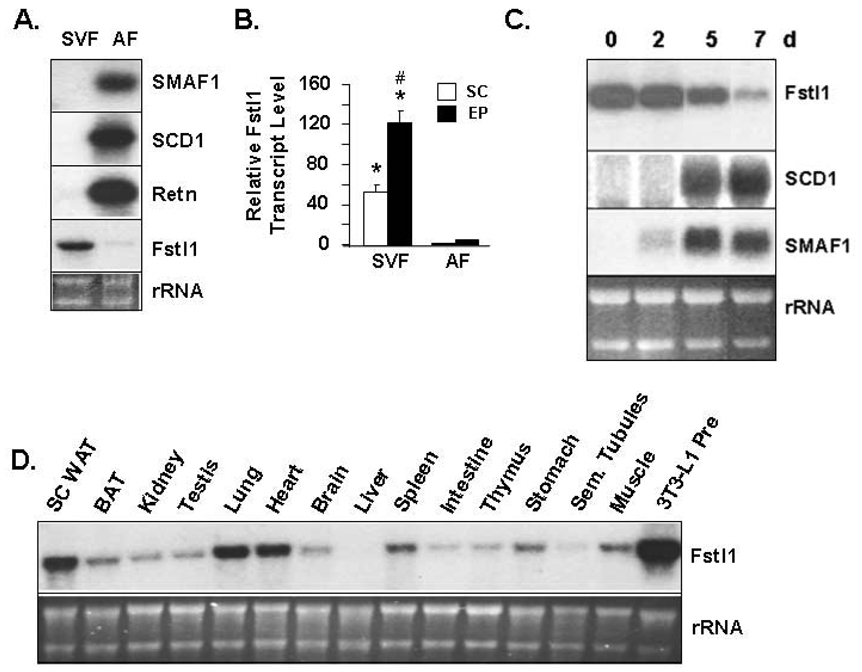
Figure 3. Fstl1 Transcript Expression in Cellular Fractions of WAT and in Adipogenesis of Primary Preadipocytes.
A. Fstl1 transcript in stromal vascular fraction (SVF) and adipocyte fraction (AF) of murine WAT. Northern blot shows transcript level for SMAF1, SCD1, Retn and Fstl1. B. Q- PCR assessment of Fstl1 transcript level in cell fractions of WAT. cDNA derived from SVF or adipocyte fraction (AF) of subcutaneous (SC) or epididymal (EP) WAT was used for Q-PCR analysis of Fstl1 transcript. Note: the third column represents SC tissue but the white color of the bar cannot be discerned due to low column height. The level in SC AF was set to 1. * indicates p<0.001 for SC SVF vs. SC AF and for EP SVF vs. EP AF. # indicates p<0.001 for EP SVF vs. SC SVF. C. Fstl1 transcript downregulation during adipogenic conversion of rat primary white preadipocytes. RNA was collected from preadipocytes (0) and at indicated times post-induction of adipocyte differentiation and analyzed by Northern blot using murine Fstl1, SCD1 and SMAF1 cDNA probes. D. Fstl1 transcript level in a panel of adult murine tissues. 5 µg of total RNA from indicated tissues were analyzed by Northern blot using murine Fstl1 cDNA probe. For A, C and D, EtBr staining of rRNA is shown as a gel loading control.

