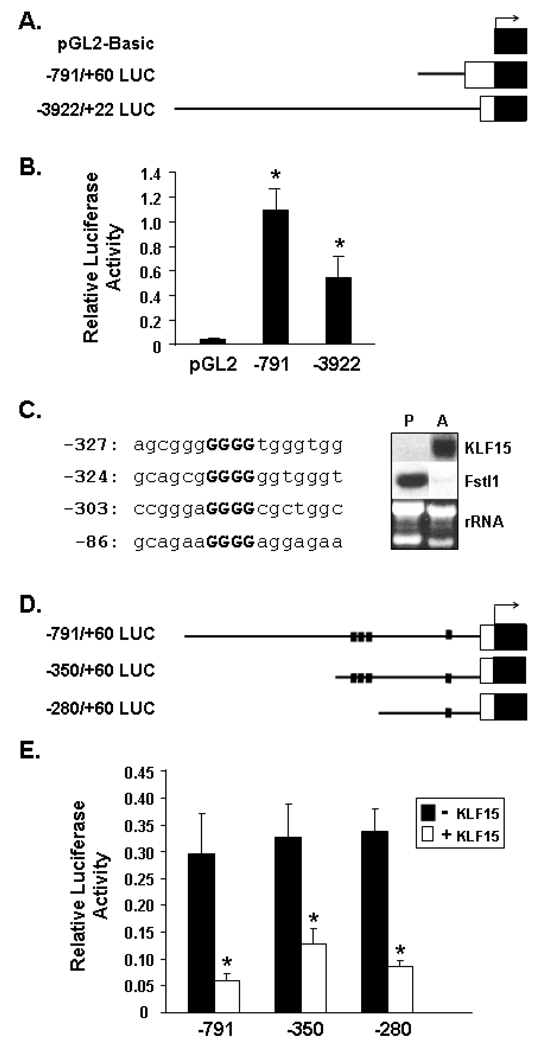
Figure 9. Promoter Activity and KLF15 Regulation of the Murine Fstl1 5’ Flanking Region.
A. Schematic diagram of Fstl1-luciferase constructs. The solid line represents the Fstl1 promoter region, the white box the 5’ untranslated region of Fstl1, and the black box the luciferase reporter gene. B. Promoter activity of Fstl1 5’ flanking region in 3T3-L1 preadipocytes. 3T3-L1 preadipocytes were transfected with the indicated luciferase reporter constructs (−791 or −3922) or empty pGL2-Basic vector (pGL2). An * indicates p<0.001 compared to empty pGL2-Basic vector. C. Left Panel: Sequence of putative KLF15 sites in the Fstl1 5’ flanking region. The consensus core motif of the inverted KLF sites are in bold. Numbers at left refer to the most 5’ position of the sequence relative to the Fstl1 transcription start site. Right Panel: Northern blot analysis of KLF15 and Fstl1 transcripts in 3T3-L1 preadipocytes (P) and 7 d adipocytes (A), with rRNA shown as a loading control. D. Schematic diagram of Fstl1-luciferase constructs containing putative KLF15 binding sites. The diagram key is as for A, above. The small black squares indicate putative KLF15 binding sites. E. Regulation of Fstl1 promoter by KLF15 in preadipocytes. 3T3-L1 preadipocytes were transfected with luciferase reporter constructs containing 791 bp, 350 bp or 280 bp of the Fstl1 gene 5’ flanking region with or without cotransfection of a KLF15 expression construct. * indicates p<0.01 for (+) KLF15 co-transfection vs. (−) KLF co-transfection. Data represent the mean ± S.D. from a minimum of triplicate transfections.

