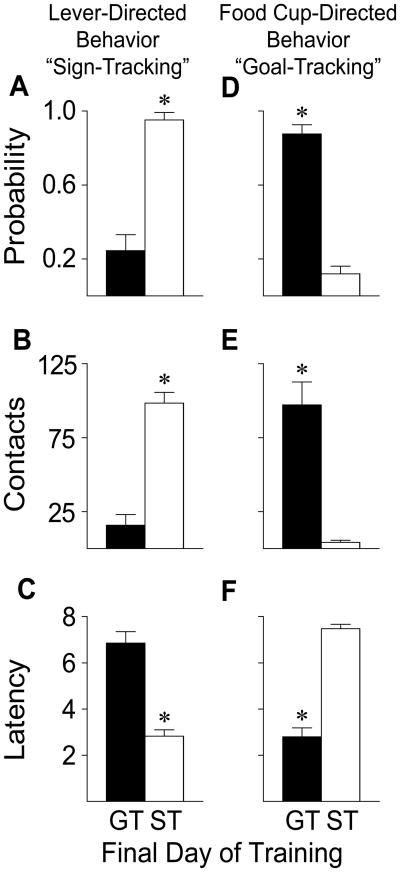
Figure 2.
Behavior directed towards the lever-CS (“sign-tracking”) or the food cup (the location of US delivery; “goal-tracking”) during the 8 s CS period on the final day of Pavlovian training. The topography of the conditional response (CR) is different in rats designated sign-trackers (STs, n=14) vs. goal-trackers (GTs, n=16). The mean ± SEM for (a) probability of approaching the lever [# trials with a lever contact/#trials per session] (CS) during the 8 s CS period, (b) number of lever contacts (c) latency to the first lever contact after CS presentation, (d) probability of approach to the food tray during the 8 s CS period, (e) number of food tray contacts during the CS period, and (f) latency to the first food tray entry after CS presentation. *, indicates significant group differences, p < 0.001.

