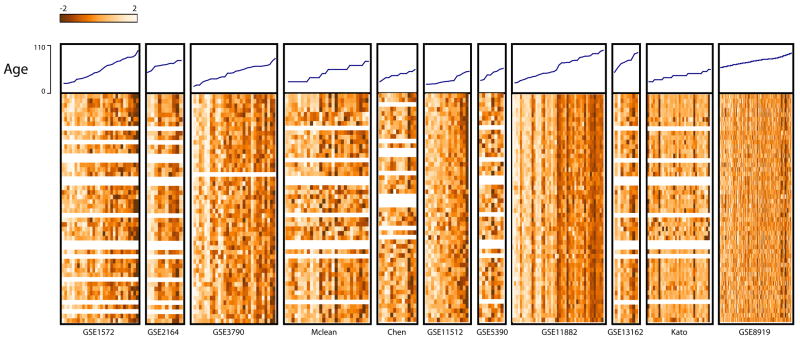
Figure 3. Top genes down-regulated with age.
The top 50 age down-regulated genes were selected based on meta-analysis q-value ranking. For each gene, the corresponding data from each study was extracted and converted to a heat map. Expression values were normalized across samples within each dataset, and ordered by age. Age is plotted at the top of each heat map. Light values in heat map indicate higher expression. Grey bars indicate missing values. All data sets are at approximately the same horizontal scale except the last, which is compressed to fit on the page.

