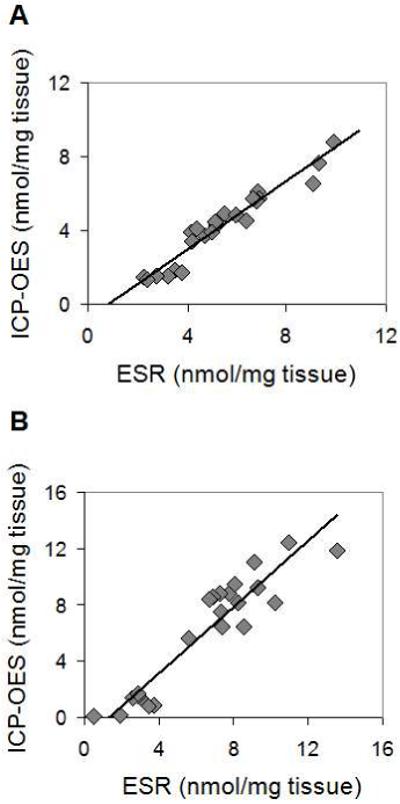
Figure 4.

Comparison of ICP-OES and ESR methodologies for MNP concentration analysis of (A) liver and (B) spleen obtained from rats which were administered with different concentrations of magnetic nanoparticles within the range of 12-25 mg Fe/kg. ICP-OES and ESR data sets show strong positive correlation with r = 0.97 and r = 0.94 for the liver and the spleen tissues, respectively.
