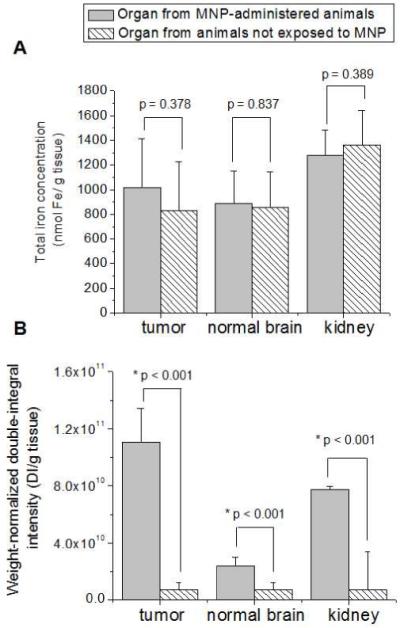
Figure 6.

(A) ICP-OES and (B) ESR analysis of low MNP accumulating organs from animals administered with MNP under magnetic targeting (test) and animals not exposed to MNP (blank). Data of ICP-OES analysis are expressed as total iron concentration of the tissue. Data of ESR analysis are expressed as a double integral of acquired spectra normalized by the weight of tissue samples. Statistically significant difference in corresponding parameter between the nanoparticle-containing and blank organs is indicated by an asterix (*).
