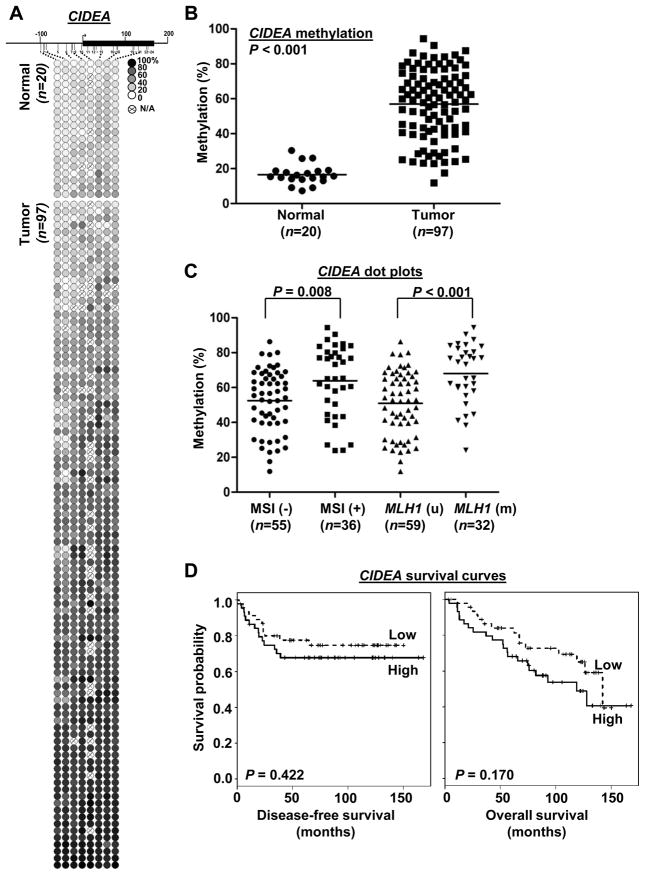
Fig. 3.
Methylation of CIDEA CpG island and clinicopathologic covariates analyses in primary endometrial carcinomas. (A) Methylation profiles of 20 normal endometrial tissues and 97 primary tumors created following MassARRAY analysis. Each row represents a sample and each column represents a CpG unit. Color-coding depicts the degree of methyltion with dark black being 100% and white being 0%; N/A, not analyzable. (B) Dot plots pointing that CIDEA hypermethylation was in endometrial tumors. Each dot represents the mean of each specimen on the all CpG sites in Fig. 3A. Horizontal lines, mean values. P value was calculated by two-sample t-test. (C) Dot plots indicating the level of CIDEA promoter methylation was correlated with MSI and moderately associated with MLH1 methylation status. P values were calculated by two-sample t-test. (D) Kaplan-Meier curves for disease-free and overall survivals. Samples were grouped according to the mean level of methylation for the all CpG units of CIDEA while methylation was dichotomized into low/high group based on the median methylation level. Vertical bars represent excluded cases. P values were estimated from Log-rank test.

