

Abstract
Associations between hunger and eating and between thirst and drinking are generally weak. This stems, in part, from limitations in the measurement of these sensations which generally rely on temporal, motivational, metabolic and/or self-reported descriptive indices. Each is critically reviewed. Also problematic is the fact that the deterministic depletion-repletion concept of ingestive behavior fails to account for influences of a multitude of contravening cognitive, social, sensory and logistical factors. Although hunger and thirst serve some parallel purposes, sharp distinctions are also present with health implications. Of particular note are the observations that thirst ratings are higher and more stable over the day compared to hunger and thirst may be more motivating to drink than hunger is to eat. Coupling these observations with evidence that beverages have limited satiety value, they pose particular challenges and opportunities. Beverages can facilitate the delivery of nutrients to those desiring or requiring them, but also to those where they are not desired or required. The benefits and risks are a function of their use rather than their inherent properties.
Keywords: hunger, thirst, appetite, eating, drinking, food, beverage, human
Introduction
In a broad sense, few would have difficulty distinguishing between eating and drinking, their primary substrates, foods and beverages, or their primary attendant sensations, hunger and thirst. However, many ambiguities emerge when viewed by conceptual, behavioral or physiological perspectives. Eaten foods contain water (1) and generate water endogenously during their metabolism; a principle expected function of drinking beverages. At the same time, drinking certain beverages provides energy (2) and essential nutrients, a principle expectation of eating foods. Foods may be differentiated from beverages based on physical form, but there is no clear cut-off along the continuum from clear liquids (e.g., water, apple juice) to semisolids (e.g., shakes, blended fruits, drinkable yogurts) to solid items. Further, a classification on this basis may be modified by the mode of conveyance of the same substance to the oral cavity such as by a particular vessel (e.g., glass, mug, bowl) or utensil (e.g., straw, spoon). Is broth a beverage when sipped directly from a mug, but soup when eaten with a spoon from a bowl? Physiologically, is the critical distinction made when viewing an edible substance, the physical structure of the item upon entry into or exit from the oral cavity or the form at some other point along the GI tract? Should gelatin be considered a semisolid because it is masticated in the mouth or a beverage because it is rapidly converted to a clear liquid in the stomach? Even more problematic are questions that arise when single items are combined. How is an item regarded as a beverage in one instance transformed to another form when consumed separately, but in conjunction with another item (e.g., a glass of milk with a sandwich), mixed with another item, but distinguishable (e.g., milk added to dry cereal) or mixed with another item and not readily separable (e.g., milk mixed into oatmeal)? Further, are there different biological consequences of consuming the item in these various contexts? Each of these distinctions may modify the cephalic, oral, gastric intestinal and post-intestinal responses the ingested items elicit. Finally, does A) a lack of clear boundaries on these issues; B) increasing consumption of products that deceive traditional physiological signaling mechanisms (e.g., foods modified in energy content); C) processing modifications that alter the degree or location of their digestion/absorption; or D) possibly the growing diversity of items ingested with less introspection about the consequences of their ingestion (i.e., distracted eating), blur distinctions between perceptions of hunger and thirst? Although there is some evidence to the contrary (3, 4), there are concerns that such a confusion can lead to eating in response to thirst or drinking in response to hunger. The former can lead to positive energy balance if the energy value of selected foods exceeds that of a beverage that could have been ingested to alleviate thirst and the latter can have the same effect if the beverage provides uncompensated energy in the diet. Failure to account for subtle distinctions can mask important relationships (5, 6). Resolution of the controversy over the implications of beverage consumption on energy balance, in particular (7-12), will likely require more nuanced and integrative approaches than those currently used. The present limited review will take a largely behavioral approach to identify limitations of current popular research methods for assessment of hunger and thirst and their relationships to eating and drinking with the aims of challenging beliefs based on evidence failing to account for the complexity of the issues involved. Distinctions between the hunger-feeding and thirst-drinking relationships will be highlighted aiming to stimulate more creative and rigorous future research approaches on the role of beverages in health. Finally, a case will be made that beverages are a food form with unique capabilities to provide desired or undesirable food constituents in the diet. Physiological controls of thirst and drinking, pertinent to these proceedings, are reviewed by Thornton in this supplement and elsewhere (13, 14).
Patterns of eating and drinking
Eating and drinking are behaviors that provide essential sustenance, sensory reward and social context. Consequently, they comprise a considerable proportion of daily activity. According to the 2007 Bureau of Labor Statistics American Time Use Survey and Educational Research Service Eating and Health Module (“http://WWW.ers.usda.gov/Data/ATUS/2007/2007current.htm”), a representative sample of Americans over the age of 15 years of age ate and drank a mean of approximately 157 minutes daily. This was the primary activity for about 67 minutes and a secondary activity (i.e., conducted in concert with a different primary activity like driving a car) for the balance. Drinking represented almost 72% of secondary eating and drinking. In only 36% of instances eating and drinking were concurrent as secondary events. However, there is considerable inter-individual variability in these estimates. About 11.1% of the population reported drinking a mean of 8.2 hours per day. Add to this, the time spent thinking of eating and drinking (no present estimates), acquiring foods and beverages (6-8 minutes/day in the population, but 40-45minutes among those who actually grocery shop), as well as preparation and clean-up time (27-54 minutes/day in men and women who are the usual preparers) and it is clear that from a time management perspective, this is a highly motivated activity.
Based on NHANES data from 1999-2004 and 2005-2006, American adults reported consuming 3.18 liters of water over a 24-hour period (15). These data represent a national probability sample of the civilian, noninstitutionalized US population and were collected for a 24-hour period using the multi-pass dietary recall method. Water alone contributed 33% of the total, other beverages (liquid milk, shakes, fruit or vegetable juices, juice drinks, carbonated and non-carbonated sweetened and unsweetened drinks, coffee, tea, hot chocolate, all alcoholic drinks and carbonated water) accounted for 48% of this volume with the remaining 19% derived from water in foods. This represents a 4% decline of plain water intake from 37% in the 1999-2004 data compared to the 2005-2006 data, though differences in collection methods remain a possible explanation (beginning in 2002, dietary data were collected by an automated procedure). Absolute water intake also declined between 1999-2004 and 2005-2006 by about 5%. There was a direct relationship between eating episodes and intake of water from all sources. Water from foods, but not other sources was higher on weekends than weekdays. Water intake was not associated with total energy intake, but other analyses using the same database noted an inverse association (16), likely due to differences in interpretative data coding. The NHANES survey (15) and DONALD study (17) reveal an inverse association between water and fat intake. There is speculation that this may reflect a biological preference for lipid metabolism as a defense against dehydration due to higher metabolic water production (18), but this may also just result from more general behavior-based dietary patterns.
Some ingestive behavior appears homeostatic and some seemingly does not. This remains a controversial area with different opinions on whether there is regulation or control and of what. One view holds that there is a fundamental physiological attribute that is regulated, such as body composition (19, 20), others argue for the primacy of energy production (21) while still others suggest an absence of regulation (22). These positions lead to different conclusions about the causes and remedies for undesirable body weight excursions. However, from any perspective, there is agreement that there are internal and external influences on food and beverage choices, with appetitive sensations, reflecting both sources, prominent among them. Thus, there is considerable interest in the measurement, function and predictive power of appetitive sensations for ingestive behaviors.
Patterns of hunger and thirst and their relationships to eating drinking
It is first necessary to provide operational definitions of hunger and thirst. Hunger describes those sensations that promote attainment of minimal energy needs while thirst represents sensations that promote attainment of minimal hydration needs. It is recognized that eating (23) and drinking (24) can occur in the absence of need, but the conditions (e.g., social expectancy) or sensations (expected sensory stimulation) that prompt such behaviors are better defined as desire to eat or drink rather than hunger or thirst. Although parallels in the homeostatic definitions exist, there are also fundamental differences between hunger and thirst with functional implications. The failure to ingest sufficient energy to meet daily needs results in unpleasant hunger sensations. However, this signal to seek energy can be ignored; temporarily displaced in consciousness by other concerns for some time or overridden for an extended period without dire consequences. Total fasting, but including water, is typically not fatal for many weeks. In contrast, failure to ingest water (regardless of form) rapidly leads to intense thirst, compromised function within days due only to a 1-2% reduction of body weight via dehydration (3), and death generally within a week. The imperative for access to water is underscored by the “Right of Thirst” in Jewish and Islamic law as well as philosophies in India, Africa and Australia which dictate that even strangers be granted access to water in times of need (25). Thus, thirst is an especially salient deprivation-based signal compared to hunger. In contrast, eating to excess holds greater consequence than drinking to excess, except in extreme cases. The former leads to weight gain and complications that historically and presently compromise(d) fitness (26). This is not the case for drinking more than needed because of the efficiency of water excretion. Thus, taken together, there is strong motivation to drink with little consequence of doing so in excess. Conversely, the signal to eat is weaker and the consequences of excess intake are more problematic. This then leads to the potential for thirst to more effectively promote drinking even in surplus of need relative to the relationship between hunger and eating (27). Such a view is consistent with observed differences in daily thirst and hunger patterns where self-reported thirst is higher than hunger. In addition, thirst ratings are more consistent over the day compared to the episodic pattern observed for hunger (27). The later observation may stem from more frequent drinking, less gain in rebound thirst between drinking bouts and/or less population ingestive synchrony.
We recently explored these options in greater detail in a convenience sample of 53 (18M, 35 F) healthy, adults (mean (SD) age = 28.8±10.5 years) with a mean (SD) BMI of 26.3±5.0 kg/m2. They recorded their hourly weekday and weekend appetitive sensations on visual analog scales (28) presented on personal digital assistants with time/date stamps to ensure responses were recorded at the expected times. They also concurrently recorded the timing and composition of all ingestive events on a dietary log. The appetitive records indicate that the proportion of people eating and drinking peaks several times per day, especially on weekdays when ingestive events may be more regimented (Figure 1). In our sample, there was an extra drinking peak in mid afternoon (Figure 1, panel C). This could be due to higher sustained thirst over the day (4), easier accessibility to beverages (e.g., water fountains are still more ubiquitous that food sources) and greater acceptability to drink in multiple social and professional contexts. Otherwise, the peaks are highly synchronous. This agrees with work in both animal models (4, 29, 30) and humans (4, 24, 31, 32) that show about 70-75% of drinking occurs peri-prandially. The weekday versus weekend differences in ingestive episodes highlight the importance of lifestyle and social custom on this activity (33). However, a lack of constraints on ingestive opportunities during the workweek does not appear to explain the patterns observed here. The number of eating events did not differ on weekdays (mean±SE = 4.6±0.3) and weekend days (4.3±0.2), nor did drinking events (5.7±0.4) on weekdays and (5.3±0.4) on weekend days. Instead, these ingestive events are just distributed differently over the days with greater synchrony on weekdays.
Figure 1.

Proportion of participants (N=53) self-reporting eating or drinking occurrences each hour of the day. Panel A= percent drinking on weekdays and weekend days; panel B=percent eating on weekdays and weekend days; panel C=percent drinking and eating on weekdays; panel D=percent drinking and eating on weekend days.
The patterns for energy and fluid volume consumed over the day are quite different. On weekdays, there are discrete peaks in energy intake in the morning, mid-afternoon and evening (Figure 2, panel B), while the volume of beverage intake rises early in the morning and fluctuates little over the day (Figure 2, panel A). Energy intake shows less distinct peaks on the weekend while fluid intake again increases early and remains elevated throughout the day (Figure 2, panel D). These patterns reflect the higher number of drinking events compared to eating and a lesser discrepancy in portion size (volume) for beverages consumed during and outside the most common ingestive event times.
Figure 2.

Mean energy content of food and volume of beverage consumed during each hour of the day. Panel A= volume (oz) of beverage consumed on weekdays and weekend days; panel B=energy (kcal) consumed on weekdays and weekend days; panel C= volume and energy consumed by drinking and eating on weekdays; panel D= volume and energy consumed by drinking and eating on weekend days.
Measurement of hunger and thirst
Although hunger and thirst account for only a portion of the motivation to eat and drink, with factors such as boredom, hedonism, social custom and anticipated needs (34) also contributing, they are widely assessed as proxies or predictors of food and beverage intake. There are four common measurement approaches.
A. Temporal Properties of Hunger and Thirst
It is assumed, but not well supported, that there are consistent relationships between the timing of ingestive events and hunger/thirst sensations. The most intuitive relationship holds that as time since the last ingestive event increases the need for energy and water will grow and be reflected by increasing hunger or thirst intensity. Thus, sensation intensity should be greatest after the longest inter-ingestive interval. This is typically the overnight fast, yet multiple trials reveal hunger is not at its daily peak upon awakening during weekdays (27, 33). This may be truer on weekends, again underscoring the influence of custom on hunger reports. Further, it is a common experience that hunger sensations can be attenuated or ignored when individuals are distracted by other interests (34). In some contradistinction to hunger, thirst is often high upon awakening and mean values show little variation over the day (27). Thus, thirst ratings offer limited discrimination. However, group-level analyses may lack sensitivity due to individual differences in ingestive patterns and possible interactions between eating and drinking and hunger and thirst. In our recent trial, all eating and drinking events that were not preceded by other ingestive events for four prior hours were identified. The growth of hunger leading to these eating events was determined over this interval (Figure 3 left, solid black bars). A graded growth of sensation was noted with a rise of approximately 72% of the peak over the four hours. Interestingly, if the same analysis was undertaken with exclusion of all solid foods, but not beverages (i.e., assuming independent hunger and thirst systems), the absolute level of hunger was consistently augmented by about 6.4% (Figure 3, left, hatched bars). This was true despite the fact that about half of the drinking events yielded energy. This suggests drinking augments hunger. It was not possible with the existing data set to explore possible differential effects of beverages with varying properties (e.g., sweeteners, caffeine concentration, etc), but this would be worthy of further consideration. Thirst differed again from hunger in comparable analyses. The thirst ratings were markedly higher than the hunger ratings and growth of thirst over the four hour period prior to drinking when nothing else was ingested was markedly flatter (30% rise relative to the peak) (Figure 3, right, solid black bars). Further, in contrast to the effects of drinking on hunger, eating did not augment thirst (Figure 3, right, hatched bars). It should also be noted that the eating events led to a 50% drop in reported hunger (relative to the peak) whereas the reduction of thirst post-drinking was only 33%. These latter observations contribute to the higher daily thirst ratings compared to hunger ratings and suggests that in free-living individuals, either drinking is terminated at levels that do not elicit large changes of thirst or that thirst is less responsive to drinking than hunger is to eating. The lack of experimental control in our trial precludes assessment of this issue with the present data. However, it may be noted that the time required to quench thirst by drinking is very short, possibly as little as 1-2 minutes (35), but generally less than 10 minutes (36). Alleviation of hunger by eating typically requires substantially longer potentially reflecting finer control over hydration needs where small deficits evoke a response before needs become great and intake is limited to smaller quantities. However, due to weak consequences of over consumption, they evoke a lesser thirst reduction. Given the number of drinking episodes was only slightly greater than eating episodes, the former mechanism seems less likely. Nevertheless, taken together, the data suggest temporal patterns of hunger and thirst lack consistency (hunger) and sensitivity (thirst) to be reliable markers of energy and water needs, respectively.
Figure 3.
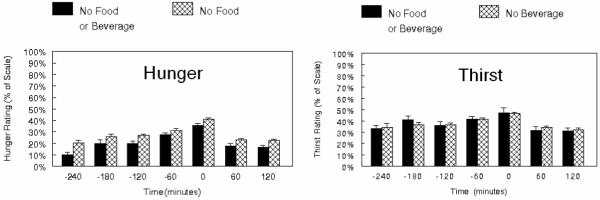
Mean self-reported ratings of hunger (left panel) and thirst (right panel) over the 4 hour period prior to an eating (left panel) or drinking (right panel) occurrence with no ingestive events occurring during the 4 hour period before or the two hours after the ingestive event (solid bars). Hatched bars represent ratings when excluding only foods, but where some drinking occurred (right panel) or excluding beverages, but some eating occurred (right panel).
B. Motivation
With hunger and thirst defined as sensations reflecting the biological need for energy and water, they should provide increasing motivation to eat or drink as need grows. This may occur by multiple mechanisms. One option posits that alleviation of the negative affect associated with biological need results in positive associative learning and enhanced goal (i.e., food or water) pursuit (37). Another possibility holds that need increases the readiness to perceive stimuli related to foods and beverages leading to an increased probability of ingestive behaviors (38, 39). Still another explanation, though these are not mutually exclusive, is that need generally enhances the valence of foods and beverages resulting in increased approach tendency (37, 40). Motivational effects may be stronger for thirst and drinking than hunger and eating. A revealing indication of this is derived from self-reports of the stress associated specifically with fluid restriction by those advised to limit total food and beverage intake such as hemodialysis (41, 42) and pre-surgery patients (43). For example, in one published account with self-reports of the discomfort associated with different aspects of the experience, thirst was rated as a 3.34 on a 5-point category scale (5=extreme) whereas hunger was rated only 1.31 while the anxiety and lack of sleep that preceded the surgical procedures were only rated as 2.12 and 1.84, respectively. This may relate, in part, to a direct association between thirst and pain perception (44). Studies of associative learning provide another index of differences between systems. There are mixed reports that ingestion of a specific food when hungry enhances later intake (45, 46), but drinking a specific beverage when thirsty prompts greater consumption of the same beverage compared to a different beverage consumed during a less-thirsty state (and no increment in food intake), at least in short-term tests (47).
A facet of ingestive motivation that has received limited attention is individual variability. In trials were free-living adults recorded hourly appetitive sensations, inter-individual daily means differ markedly, especially for thirst (27) (Figure 4). The basis and implications are not known. It may be individuals who eat or drink less report higher hunger or thirst; a scenario that is intuitive and begs the question; why they don’t eat or drink more to alleviate the presumed unpleasant sensations? Purposefully over-riding the sensations may occur during dieting, a common practice in the population (48). However, this does not explain the reported observations since all participants indicated they were weight stable and not dieting. Further, they did not score as highly restrained. Individual differences in reporting (i.e., scale use) can also be discounted because the studied participants did not show comparable differences for non-appetitive sensations included to detect malingering (e.g., hand steadiness or itchiness of the scalp). Greater tolerance of discomfort or asceticism are possibilities that remain unexplored. Whatever the explanation, the prediction would be that non-dieting or restrained individuals who eat less despite higher hunger and thirst would tend to be leaner. Alternatively, it may be that some individuals inherently experience greater hunger and/or thirst and this would motivate them to eat and/or drink more. The prediction here would be that those at the high end of the distribution would have greater risk for weight gain and higher BMI. However, the prior (27) and current trials have not detected a significant association between self-reported hunger or thirst and either energy intake or BMI. Elucidation of the basis for this lack of association could still be valuable for understanding individual ingestive behaviors.
Figure 4.

Mean and range of daily hunger and thirst ratings (between 09:00 and 21:00 h) for 50 individuals. Each bar represents the highest and lowest daily mean of 7 consecutive days. (reprinted from McKiernan et al., Physiol & Behav 2008;94:700-708).
C. Physiological Indices
An objectively measurable physiological regulator or predictor of appetite sensations and ingestive behavior has been sought for decades with limited success. The growing identification and characterization of peptides with appetite-related activities has recently stimulated interest in their use as biomarkers of appetitive system status (49). However, relatively normal appetitive responses are observed in individuals without segments of the GI tract (e.g., post-gastrectomy (50) or when the GI tract is bypassed via total parenteral nutrition (51, 52). Furthermore, hormones that exert clear causal effects under extreme conditions may evoke little or no responses at more physiological concentrations (53). These observations reflect the redundancy in the factors influencing appetitive sensations, complex interactions between the peptides themselves and other biological systems as well as their multiple physiological roles. A brief consideration of a few of the most extensively studied will suffice to raise questions about their utility for explaining appetitive sensations and predicting feeding.
Insulin is a well established satiety hormone (20), but hunger may be strong when its concentration is high or low. Rapid ingestion of a concentrated solution of glucose in water will stimulate insulin secretion. This, in turn, will prompt clearance of glucose from the blood. Some argue that conditions of elevated insulin and lower blood sugar stimulate hunger (54) and posit that this will lead to greater energy intake, positive energy balance and weight gain. Others note that ingestion of fructose, a low glycemic index energy source, is problematic for weight gain because it has a weak stimulatory effect on insulin and, as a result, limited augmentation of leptin post-prandially (55). The low level of leptin, a putative satiety hormone, would then lead to higher hunger with consequential greater energy intake, positive energy balance and weight gain. Thus, in response to two different carbohydrate sources, insulin is predicted to be either high or low yet lead to the same effect on hunger and intake. The physiological basis for the discrepant insulin responses may be sound, but this raises questions about the use of insulin as a predictor of hunger or feeding behavior.
Leptin is another problematic example. Although there is an acute leptin response to meals, concentrations are directly related to body fat stores (56). Thus, in patients with anorexia nervosa, who generally have low body fat composition, leptin concentrations are low (57). The low leptin level should theoretically be associated with increased hunger in these individuals, due, in part, to leptin’s inhibition of the activity of anandamide, an endogenous ligand for the endocannabinoid system. In contrast, individuals with binge eating disorder tend to have higher body fat and circulating leptin concentrations (58), so should be less hungry. In the later case, the high leptin concentration should inhibit anandamide effects. However, just the reverse is observed (58). Anandamide concentrations are elevated, possibly due to decreased sensitivity to leptin signaling in this population. The result is that, here again, high and low concentrations of this key appetitive hormone are associated with similar predictions on appetite and intake. Questions also exist for the utility of ghrelin, a reported orexigenic hormone, as a predictor of hunger and feeding (59). Plasma concentrations of this hormone are modified by customary feeding patterns and tend to peak about 30 minutes prior to anticipated mealtimes (60). Thus, concentrations would likely hold limited predictive power without prior knowledge of eating patterns, the outcome in question. Moreover, it is not clear that variations in hunger stem for oscillations of ghrelin or just the reverse. In a study of individuals with regular feeding patterns, hunger and fullness changes preceded changes in ghrelin (60). Similarly, correlations between thirst and biomarkers of the physiological systems that regulate fluid balance (e.g., percent short-term body mass (water) loss, serum osmolality, plasma volume) are weak and there is no single index that is a reliable predictor (3, 61, 62). Patterns of changes in the biomarkers of processes associated with hunger and thirst may hold greater predictive power as they are highly interactive, but this remains to be explored.
D. Self-Reported Somatic Sensations
The most common approach for measurement of appetitive sensations is by self-reports of various somatic sensations on open ended questionnaires or rating scales. Questions about level of hunger, fullness, desire to eat and amount that could be eaten are widely used, but additional questions about thirst and desire to eat more specific products such as sweet, savory or fatty items are not uncommon. While some support for the validity of this approach has been published (63), the lack of a gold standard precludes a true test of this method. One of the concerns with this approach lies in the lack of clarity of the questions posed and what they report to measure.
Open ended questionnaires indicate that study participants experience a wide range of sensations that they collectively refer to as hunger. These include sensations directly related to the stomach (e.g., growling, aches) or head (headache, light-headedness, dizziness, loss of concentration), more generalized sensations (e.g., weakness, anxiety, nausea) and attributions to other sensory systems such as those related to fluid balance (e.g., thirst mouth dryness, mouth watering) (64, 65). Whether there are real inter-individual differences in the sensations experienced or just a lack of a common lexicon, without training study participants on reporting outcomes, it is not clear what insights the questions yield. If the prior mentioned literature review is accurate, one would have to conclude that appetitive sensations either contribute little to ingestive behavior or the sensations are important determinants, but are not adequately measured.
The problem is equally complex with thirst. Reports associated with dehydration include oral sensations (e.g., dry, scratchy mouth and throat, chapped dry lips) general symptoms (e.g., tiredness, irritability), attributions to other sensory systems (e.g., loss of appetite) and non-oral sites (e.g., light-headedness, dizziness, headache) (66). In particular, there is a common problem of distinguishing between reports based on oral dryness versus a more specific motivational state (3, 67-69). In our recent exploration of the lexicon associated with this sensation, it became apparent that there is no easily accessed term for the opposite of thirsty. After being challenged with this, some individuals suggested the term quenched, but this is not a term participants who feel the sensation daily readily acknowledge and it is non-specific. This raises a second issue, while there may be physiological and theoretical bases for querying individuals on different sensations, it is not clear that study participants discriminate between them as researchers expect. For example, it is often argued that hunger and fullness are not simply opposite poles of a single continuum, but actually have different physiological regulatory systems. Thus, they may vary independently after ingestion of a particular food or beverage. However, untrained study participants may not be so discriminating and may, in fact, be concerned about not being regarded as conscientious if their responses to the two questions don’t covary in an intuitive way. In a recent 8 week cross-over design feeding trial involving required consumption of various beverages that may be expected to differentially influence systems subserving hunger and fullness, participants were asked to provide hourly reports of these sensations. Participants included 34 weight stable men and women, 18-40 years old, with a BMI of either 18-23 (N=15) or 27-35 (N=19). Responses for individuals tested at three time points, baseline week 6 and week 8 are displayed in Figure 5. It is apparent that these ratings are mirror images of each other and that the two questions yielded no unique information. This is apparent from other work as well (70).
Figure 5.
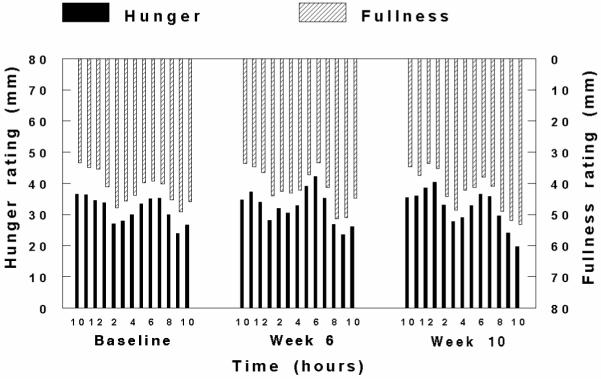
Mean hunger (rising from the bottom x-axis) and fullness (dropping from the top x-axis) ratings from 34 healthy adults at baseline and weeks six and eight of an intervention involving fruit and vegetable consumption. Ratings were obtained on a 100mm VAS between the hours of 10:00 and 22:00.
Clarity is also lacking on the part of investigators. In a recent study specifically designed to explore the structure of appetitive sensations, participants were asked if it is possible to be hungry and full at the same time (34). Participants indicated this was possible and offered comments reflecting this view that included statements about how boredom can lead them to eat, hence they were somewhat hungry, yet still feel relatively full or that they may crave something, indicating they have some level of hunger, yet they also feel full. These examples seem to more closely reflect a desire to eat dimension than hunger, yet are considered as reflecting hunger by both the participants and researchers. This may be reasonable if hunger is defined as general motivation to eat, but then why would questions about desire to eat and hunger be asked?
The latter point raises the broader question of analyses of appetitive ratings. As noted, commonly, four questions are asked, although eight or more are not infrequently included. In any case, from a research design perspective, only those sensations for which there is an a priori hypothesis stated should be included and analyzed. If there are no specific hypotheses being tested, post-hoc analyses should include a correction to reduce the probability of a type 1 error. This is rarely reported and weak, but statistically significant effects are noted for any of the multiple questions asked. This violation of common statistical principles has likely not benefitted the field.
Most commonly, ratings are obtained in preload studies where study participants ingest a defined portion of a food, beverage or mixture of interest, followed by self-reports of appetitive sensations for a period of time. Often, an unlimited quantity of a challenge food, beverage or mixture is presented some time after the preload to determine the amount consumed. A model based on such a design is shown in Figure 6. The abscissa is time and the ordinate is hunger or thirst sensation. The “consumption threshold” line depicts the sensation level above which an individual is sufficiently motivated to seek food or a beverage. As shown in the hypothetical plot, following an eating/drinking episode, hunger/thirst declines. The magnitude of decline is determined by properties of the ingested food or beverage (e.g., sensory, physical, nutritive) as well as characteristics of the consumer (e.g., cognitive state, health status). After reaching a nadir, hunger/thirst sensations begin to rebound. The model predicts that a function of the magnitude of sensation decline after an ingestive event and rebound time will determine when the consumption threshold is again crossed and the next eating occasion will commence.
Figure 6.
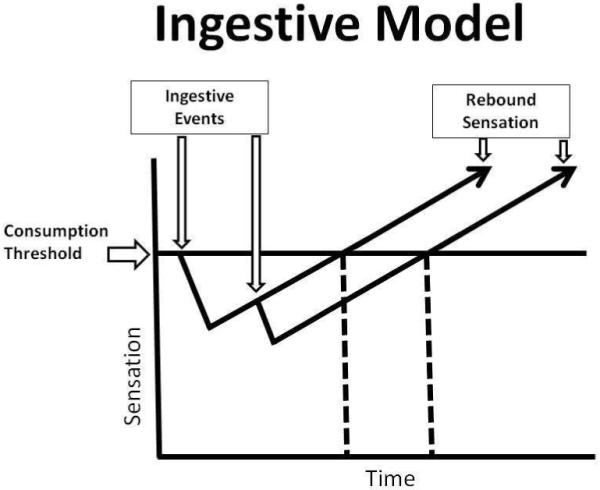
Theoretical model of appetitive changes in a preload paradigm.
Analyses of data generated by preload designs are based on rate, time and event indices. The former includes variables such as the rate of change of sensation within an eating event or rate of rebound sensation. Changes within an ingestive event have been the focus of studies on the microstructure of eating (5, 71, 72) Recent work suggests there may be a genetic basis for such appetitive indices (73). Time variables commonly include the duration of an eating or drinking event and the inter-ingestive event interval (rebound time) while examples of event endpoints are the number of ingestive events and their composition.
There are three dynamic aspects of the model. One is the initial ingestive event (i.e., preload). This component has been the focus of considerable work due to evidence that portion size is a determinant of the amount consumed (74, 75) and has increased, particularly with beverages (76, 77), in concert with the incidence of obesity. However, despite strong biological arguments for a focus on “meal” size (19, 20), we suggest that the emphasis on this aspect of the model may not be well justified in humans for two principal reasons. First, preload studies, by design, measure treatment effects over a short interval. Thus, such work typically fails to capture compensatory dietary responses that occur later in the day or over a longer interval. Strong, albeit not perfect, compensation has been documented in children (78) and adults (27). In a trial with children, foods were provided at six time points over the day corresponding to three “meals” and three “snacks.” The coefficient of variability was very high at each eating event, but markedly reduced when averaged over the six time points. Thus, larger eating events were followed by smaller ones and vice verse. A similar design was used for the adult study except participants were free-living. The same pattern of high variance at each individual eating event, but marked reduction over the day was observed and all correlations between successive eating events were negative. Consequently, energy intake at a given meal, even if high, is not predictive of energy intake over a longer timeframe. Second, due potentially to this fact, meal size appears to play a lesser etiologic role in the incidence and prevalence of overweight/obesity trends. Data from the 1977-78 Nationwide Food Consumption Survey and 1994-1996 Continuing Survey of Intake by Individuals (CSFII) indicates that meal size changed little over this two decade period (79). In males, the mean changes in self-reported breakfast, lunch and dinner energy intake were 36kcal, 50kcal and -59kcal, respectively. The values were 26kcal, 31kcal and -74kcal for females. In contrast, these data reveal that males and females increased their eating frequency by about 0.6 eating events per day. This additional ingestive event was relatively high in energy, contributing 241kcal towards the 268kcal increment in energy among males and 160kcal among females who experienced a 143kcal increment over the study period. Thus, while a contribution of portion size is not excluded, the greater problem appears to be eating frequency (80-82). The CSFII data are now more than a decade old and may underestimate current eating frequency. Participants in our trial had a mean of 7.8±0.4 and 7.6±0.4 ingestive events on weekdays and weekend days, respectively.
If the model outlined in Figure 6 is accurate and meal size is not the primary contributor to positive energy balance, the rate of rebound hunger or thirst could be critical as it may determine eating frequency. To explore the dynamics of this phase of the model, two surveys of the literature were conducted. One explored work focusing on hunger and eating where a PubMed search included the terms hunger, meal, appetite, preload and human and was restricted to papers published between 1995 and 2005. Papers based on clinical populations and those that did not report appetite ratings over time were excluded. This admittedly not comprehensive, but also probably not biased sample, included 15 manuscripts. Papers presenting data separated by participant characteristics (e.g., gender, BMI) or testing conditions (e.g., different response formats, time of day) were included as separate (for a total of 44) data sets to explore the effects of these conditions or attributes. Thus, the data sets were not strictly independent and no formal meta-analysis was conducted, only a critical review of the literature. A parallel search was conducted for thirst and drinking with the terms: thirst, drink, beverage, fluid, appetite, preload and human. This yielded only 4 papers and 8 data sets. Many of the papers identified in the search did not include the raw thirst data and unlike the case for hunger, testing paradigms rarely tracked thirst sensations without a concomitant intervention such as hypertonic saline infusion or heat stress. Figure 7 is a scatterplot of the hunger intensity ratings expressed as a percent of the response scale over the time elapsed after preload ingestion. The data are best described by a linear function (least squares regression line displayed) (R2=0.64). The slope between successive time points did not differ. The function was largely unaltered by subject or paradigm characteristics. Figure 8 reveals the functions are strikingly stable across various conditions. It should be emphasized that these data are extracted from different studies with varying controls over the stimuli, so the panel on preload energy content does not differentiate energy source and the panel on macronutrients does not segregate food forms. Thus, unique interaction effects are possible, but the consistency across the plotted conditions suggests this is unlikely. The more limited findings for thirst are presented in Figure 9. They indicate that, in the absence of a current stress to the hydration system, the slopes of the rebound functions are similar to those for hunger, but a stressor can increase the slope. Figure 10 presents the functions representing the 5th and 95th percentiles of the slopes of the different hunger data sets. A key finding is the lack of variance. As a result, this measurement approach appears to lack sensitivity. If hunger ratings are obtained 120 minutes after the preload ingestion, the expected variability would only be on the order of 5% of the response scale. This makes measurement of treatment effects difficult, but also indicates rebound hunger, and probably thirst, are very reliable. The mean slope of the best fit regression line is 0.17±0.01.
Figure 7.

Least squares regression line fitted to a scatter plot of hunger ratings expressed as percent of scale, from a literature search of studies published between 1995 and 2005.
Figure 8.
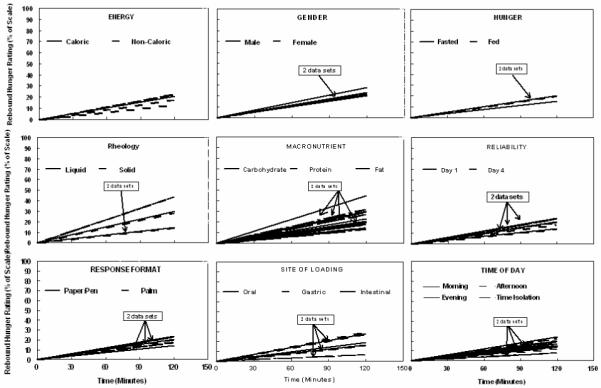
Least squares regression line fitted to hunger ratings expressed as percent of scale from a literature search of studies published between 1995 and 2005. Data are divided according to selected test conditions.
Figure 9.
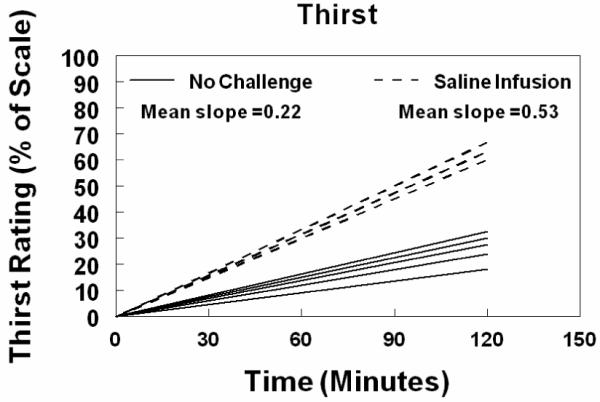
Least squares regression line fitted to a scatter plot of thirst ratings expressed as percent of scale, from a literature search of studies published between 1995 and 2005.
Figure 10.

Slopes of the 5th and 95th percentiles of hunger data, plotted as a percent of scale, obtained from a literature search of studies published between 1995 and 2005.
The consistency of rebound sensation would suggest that knowing the sensation nadir after an ingestive event, should permit a reasonably accurate estimate of the time when the consumption threshold will be crossed and the next eating event would likely start. There is some evidence for this from tightly controlled, laboratory-based studies. One example is a trial exploring the differential satiety effects of the macronutrients. The rank order of acute reductions of hunger following isoenergetic loads was protein > carbohydrate > fat and this led to the same rank ordering of delays to the next spontaneous meal request (83). Similar findings were observed with preloads varying in food form (i.e., whole fruit, fruit sauce and fruit juice) (84). In both instances, hunger ratings returned to a constant level before the next eating request. We have recently analyzed the data from this latter study for thirst ratings before intake and also find that self-reported thirst after ingestion of the three food forms reached a common intensity prior to the next ingestive event (unpublished data), a finding also reported by others (31). It should be noted that in this variation of preload design studies, i.e., where the timing of the challenge “meal” is determined by the participant rather than imposed by the researcher, intake often does not reveal treatment effects on appetite. In these examples, no treatment effects were observed for intake of a challenge meal despite differences in appetite ratings. Effects on intake are more apparent when the challenge is presented prior to the individual reaching their consumption threshold. However, based on an unbiased survey of literature over a 10 year period primarily using fixed intake designs, only about 15% reported a strong association between appetite ratings and intake (85-109). Given this discrepancy and the novelty of challenging individuals to eat when they would not do so on their own accord, extrapolation of findings from fixed interval trials to behavior in free-living individuals is problematic.
These issues aside, predicting the timing of ingestive events is complicated by the fact that the consumption threshold is also a dynamic component of the model. Common experience indicates that it varies under a wide range of conditions such as exposure to highly palatable foods and beverages or anticipatory access to limited or abundant energy or water. Certainly, it is also constrained simply by food accessibility. Indeed, due to such influences, free-living people have been observed to engage in inappropriate ingestive activities, defined as consumption when not hungry or thirsty or not ingesting when these sensations are strong, the majority of the time (4, 33).
In our recent trial, we sought to better quantify the contribution of hunger and thirst to eating and drinking in free-living individuals. Participants were asked to respond to questions about these sensations as well as questions about the probability that they would eat or drink in the next hour over 2 days (one weekday and one weekend day). The latter questions were intended to capture the contributions of appetitive and non-appetitive influences on ingestive decisions. The correlations between self-reported hunger and probability to eat and between self-reported thirst and probability to drink were computed for all eating and drinking events that were not preceded by other ingestive events over the preceding four hours. The correlation coefficients for hunger and eating 4, 3, 2 and 1 hours prior to the eating event were 0.66, 0.60, 0.52 and 0.48 suggesting a declining, rather than increasing influence of hunger over this time and that overall, hunger accounted for about a third of the variance in the probability to eat. For thirst and probability to drink, the correlation coefficients were 0.68, 0.50, 0.52 and 0.49. Thus, there was no clear trend over time and overall, thirst also accounted for about a third of the variance in probability to drink. Overall, hunger and thirst are only weak predictors of energy and fluid intake, respectively (4, 31, 33, 110) as their roles in guiding intake may be overwhelmed by environmental influences (100, 111, 112). This may be especially true for thirst in individuals at risk for dehydration, such as athletes (113) and the elderly (114, 115) or over-hydration, such as end stage renal disease patients on hemodialysis (116).
Given the lack of a clear lexicon for appetitive sensations, limited association between presumed homeostatic physiological processes and sensation reports and poor measurement sensitivity, it is not surprising that they offer only weak predictive power for feeding. Whether these observations stem from inadequate measurement methodology, a true limitation of the influence of appetitive sensation on intake, or both, warrants further consideration. Assays with these characteristics would not be tolerated in many other disciplines (e.g., engineering, physiology, biochemistry) where relationships are largely deterministic. However, as noted by others, ingestive behavior is probabilistic (117) so the same standards may not be realistic. This does not justify current methods, rather it suggests greater measurement challenges and until these are better met, a very cautious interpretation of the implications of appetitive sensations is warranted.
Concluding hypothesis
Based on the reviewed evidence that A) thirst sensations are high and stable over the day, B) the health consequences of drinking in moderate excess of need are minimal, C) there are strong non-homeostatic influences on drinking, D) beverages are highly palatable, inexpensive and convenient, E) it is socially acceptable to drink in many social and professional settings and F) beverages elicit weak compensatory dietary responses (118-121), it may be posited that beverages are an excellent nutrient delivery vehicle. This holds advantages for delivery of nutrients to those in need (e.g., cancer patients or the elderly with early satiety), but also disadvantages as they may effectively deliver nutrients and energy to those not in need (e.g., overweight/obese individuals). The benefits and problems lie not in the products, but in how they are used.
Acknowledgments
Supported by grant R01 DK63185 awarded by the National Institute of Diabetes and Digestive and Kidney Diseases.
Footnotes
Publisher's Disclaimer: This is a PDF file of an unedited manuscript that has been accepted for publication. As a service to our customers we are providing this early version of the manuscript. The manuscript will undergo copyediting, typesetting, and review of the resulting proof before it is published in its final citable form. Please note that during the production process errors may be discovered which could affect the content, and all legal disclaimers that apply to the journal pertain.
References
- 1.Meier JJ, Nauck MA, Pott A, et al. Glucagon-like peptide 2 stimulates glucagon secretion, enhances lipid absorption, and inhibits gastric acid secretion in humans. Gastroenterology. 2006;130:44–54. doi: 10.1053/j.gastro.2005.10.004. [DOI] [PubMed] [Google Scholar]
- 2.Popkin BM, Nielsen SJ. The sweetening of the world’s diet. Obes Res. 2003;11:1325–32. doi: 10.1038/oby.2003.179. [DOI] [PubMed] [Google Scholar]
- 3.Shirreffs SM, Merson SJ, Fraser SM, Archer DT. The effects of fluid restriction on hydration status and subjective feelings in man. Br J Nutr. 2004;91:951–8. doi: 10.1079/BJN20041149. [DOI] [PubMed] [Google Scholar]
- 4.McKiernan F, Hollis JH, McCabe GP, Mattes RD. Thirst-drinking, hunger-eating; tight coupling? J Am Diet Assoc. 2009;109:486–90. doi: 10.1016/j.jada.2008.11.027. [DOI] [PMC free article] [PubMed] [Google Scholar]
- 5.Yeomans MR, Hails NJ, Nesic JS. Alcohol and the appetizer effect. Behav Pharmacol. 1999;10:151–61. doi: 10.1097/00008877-199903000-00004. [DOI] [PubMed] [Google Scholar]
- 6.Mattes RD. Fluid energy--Where’s the problem? J Am Diet Assoc. 2006;106:1956–61. doi: 10.1016/j.jada.2006.10.026. [DOI] [PubMed] [Google Scholar]
- 7.Mattes R. Fluid calories and energy balance: the good, the bad, and the uncertain. Physiol Behav. 2006;89:66–70. doi: 10.1016/j.physbeh.2006.01.023. [DOI] [PubMed] [Google Scholar]
- 8.Anderson G. Sugars-containing beverages and post-prandial satiety and food intake. International Journal of Obesity. 2006;30:S52–S59. [Google Scholar]
- 9.Drewnowski A, Bellisle F. Liquid calories, sugar, and body weight. Am J Clin Nutr. 2007;85:651–61. doi: 10.1093/ajcn/85.3.651. [DOI] [PubMed] [Google Scholar]
- 10.Forshee RA, Anderson PA, Storey ML. Sugar-sweetened beverages and body mass index in children and adolescents: a meta-analysis. Am J Clin Nutr. 2008;87:1662–71. doi: 10.1093/ajcn/87.6.1662. [DOI] [PubMed] [Google Scholar]
- 11.Malik VS, Schulze MB, Hu FB. Intake of sugar-sweetened beverages and weight gain: a systematic review. Am J Clin Nutr. 2006;84:274–88. doi: 10.1093/ajcn/84.1.274. [DOI] [PMC free article] [PubMed] [Google Scholar]
- 12.Vartanian LR, Schwartz MB, Brownell KD. Effects of soft drink consumption on nutrition and health: a systematic review and meta-analysis. Am J Public Health. 2007;97:667–75. doi: 10.2105/AJPH.2005.083782. [DOI] [PMC free article] [PubMed] [Google Scholar]
- 13.Sewards TV, Sewards MA. The awareness of thirst: proposed neural correlates. Conscious Cogn. 2000;9:463–87. doi: 10.1006/ccog.2000.0462. [DOI] [PubMed] [Google Scholar]
- 14.Stricker EM, Hoffmann ML. Presystemic signals in the control of thirst, salt appetite, and vasopressin secretion. Physiol Behav. 2007;91:404–12. doi: 10.1016/j.physbeh.2007.04.007. [DOI] [PubMed] [Google Scholar]
- 15.Kant AK, Graubard BI, Atchison EA. Intakes of plain water, moisture in foods and beverages, and total water in the adult US population--nutritional, meal pattern, and body weight correlates: National Health and Nutrition Examination Surveys 1999-2006. Am J Clin Nutr. 2009;90:655–63. doi: 10.3945/ajcn.2009.27749. [DOI] [PMC free article] [PubMed] [Google Scholar]
- 16.Popkin BM, Barclay DV, Nielsen SJ. Water and food consumption patterns of U.S. adults from 1999 to 2001. Obes Res. 2005;13:2146–52. doi: 10.1038/oby.2005.266. [DOI] [PubMed] [Google Scholar]
- 17.Stahl A, Kroke A, Bolzenius K, Manz F. Relation between hydration status in children and their dietary profile - results from the DONALD study. Eur J Clin Nutr. 2007;61:1386–92. doi: 10.1038/sj.ejcn.1602663. [DOI] [PubMed] [Google Scholar]
- 18.Stookey JD. Another look at: fuel + O2 --> CO2 + H2O. Developing a water-oriented perspective. Med Hypotheses. 1999;52:285–90. doi: 10.1054/mehy.1997.0673. [DOI] [PubMed] [Google Scholar]
- 19.Woods SC, Schwartz MW, Baskin DG, Seeley RJ. Food intake and the regulation of body weight. Annu Rev Psychol. 2000;51:255–77. doi: 10.1146/annurev.psych.51.1.255. [DOI] [PubMed] [Google Scholar]
- 20.Woods SC. The control of food intake: behavioral versus molecular perspectives. Cell Metab. 2009;9:489–98. doi: 10.1016/j.cmet.2009.04.007. [DOI] [PMC free article] [PubMed] [Google Scholar]
- 21.Friedman M. Food intake: control, regulation, and the illusion of dysregulation. In: Harris BS, Mattes RD, editors. Appetite and Food Intake: Behavioral and Physiological Considerations. Taylor & Francis Group; Boca Ratan: 2009. p. 360. [Google Scholar]
- 22.Levitsky D. The control of food intake and the regulation of body weight in humans. In: Harris BS, Mattes RD, editors. Appetite and Food Intake: Behavioral and Physiological Considerations. Talor & Francis Group; Boca Raton: 2009. p. 360. [Google Scholar]
- 23.Lowe MR, Butryn ML. Hedonic hunger: a new dimension of appetite? Physiol Behav. 2007;91:432–9. doi: 10.1016/j.physbeh.2007.04.006. [DOI] [PubMed] [Google Scholar]
- 24.Phillips PA, Rolls BJ, Ledingham JG, et al. Reduced thirst after water deprivation in healthy elderly men. N Engl J Med. 1984;311:753–9. doi: 10.1056/NEJM198409203111202. [DOI] [PubMed] [Google Scholar]
- 25.Salzman J. Thirst: a short history of drinking water. Yale Journal of Law & the Humanities. 2006;17:94–121. [Google Scholar]
- 26.Prentice AM, Moore SE, Collinson AC, O’Connell MA. Leptin and undernutrition. Nutr Rev. 2002;60:S56–67. doi: 10.1301/002966402320634940. discussion S68-84, 85-7. [DOI] [PubMed] [Google Scholar]
- 27.McKiernan F, Houchins JA, Mattes RD. Relationships between human thirst, hunger, drinking, and feeding. Physiol Behav. 2008 doi: 10.1016/j.physbeh.2008.04.007. [DOI] [PMC free article] [PubMed] [Google Scholar]
- 28.Rogers PJ, Blundell JE. Effect of anorexic drugs on food intake and the micro-structure of eating in human subjects. Psychopharmacology (Berl) 1979;66:159–65. doi: 10.1007/BF00427624. [DOI] [PubMed] [Google Scholar]
- 29.Fitzsimons TJ, Le Magnen J. Eating as a regulatory control of drinking in the rat. J Comp Physiol Psychol. 1969;67:273–83. doi: 10.1037/h0026772. [DOI] [PubMed] [Google Scholar]
- 30.Kissileff HR. Food-associated drinking in the rat. J Comp Physiol Psychol. 1969;67:284–300. doi: 10.1037/h0026773. [DOI] [PubMed] [Google Scholar]
- 31.deCastro J. A microregulatory analysis of spontaneous fluid intake by humans: evidence that the amount of liquid ingested and its timing is mainly governed by feeding. Physiol Behav. 1988;43:705–714. doi: 10.1016/0031-9384(88)90367-8. [DOI] [PubMed] [Google Scholar]
- 32.Engell D. Interdependency of food and water intake in humans. Appetite. 1988;10:133–41. doi: 10.1016/0195-6663(88)90064-5. [DOI] [PubMed] [Google Scholar]
- 33.Mattes R. Hunger ratings are not a valid proxy measure of reported food intake in humans. Appetite. 1990;15:103–13. doi: 10.1016/0195-6663(90)90043-8. [DOI] [PubMed] [Google Scholar]
- 34.Murray M, Vickers Z. Consumer views of hunger and fullness. A qualitative approach. Appetite. 2009;53:174–82. doi: 10.1016/j.appet.2009.06.003. [DOI] [PubMed] [Google Scholar]
- 35.Poothullil JM. Recognition of oral sensory satisfaction and regulation of the volume of intake in humans. Nutr Neurosci. 2005;8:245–50. doi: 10.1080/10284150500449029. [DOI] [PubMed] [Google Scholar]
- 36.Denton D. The Hunger for Salt. Springer; London: 1982. [Google Scholar]
- 37.Seibt B, Hafner M, Deutsch R. Prepared to eat: How immediate affective and motivational responses to food cues are influenced by food deprivation. European Journal of Social Psychology. 2007;37:359–379. [Google Scholar]
- 38.Aarts H, Dijksterhuis A, De Vries P. On the psychology of drinking: being thirsty and perceptually ready. Br J Psychol. 2001;92:631–42. doi: 10.1348/000712601162383. [DOI] [PubMed] [Google Scholar]
- 39.Veltkamp M, Aarts H, Custers R. On the emergence of deprivation-reducing behaviors: Subliminal priming of behavior representations turns deprivation into motivation. Journal of Experimental Social Psychology. 2008;44:866–873. [Google Scholar]
- 40.Winkielman P, Berridge K, Wilbarger J. Unconscious affective reactions to masked happy versus angry faces influence consumption behavior and judgments of value. PSPB. 2005;31:121–135. doi: 10.1177/0146167204271309. [DOI] [PubMed] [Google Scholar]
- 41.Gurklis JA, Menke EM. Identification of stressors and use of coping methods in chronic hemodialysis patients. Nurs Res. 1988;37:236–9. 248. [PubMed] [Google Scholar]
- 42.Welch JL, Austin JK. Factors associated with treatment-related stressors in hemodialysis patients. Anna J. 1999;26:318–25. discussion 326. [PubMed] [Google Scholar]
- 43.Madsen M, Brosnan J, Nagy VT. Perioperative thirst: a patient perspective. J Perianesth Nurs. 1998;13:225–8. doi: 10.1016/s1089-9472(98)80018-x. [DOI] [PubMed] [Google Scholar]
- 44.Farrell MJ, Egan GF, Zamarripa F, et al. Unique, common, and interacting cortical correlates of thirst and pain. Proc Natl Acad Sci U S A. 2006;103:2416–21. doi: 10.1073/pnas.0511019103. [DOI] [PMC free article] [PubMed] [Google Scholar]
- 45.Gibson EL, Desmond E. Chocolate craving and hunger state: implications for the acquisition and expression of appetite and food choice. Appetite. 1999;32:219–40. doi: 10.1006/appe.1998.0207. [DOI] [PubMed] [Google Scholar]
- 46.Booth D, Gibson EL, Toase A, Freeman R. Small objects of desire: the recognition of appropriate foods and drinks and its neural mechanisms. In: Legg C, Booth D, editors. Appetite: Neural and Behavioural Bases. Oxford University Press; Oxford: 1994. pp. 98–126. [Google Scholar]
- 47.Durlach PJ, Elliman NA, Rogers PJ. Drinking while thirsty can lead to conditioned increases in consumption. Appetite. 2002;39:119–25. doi: 10.1006/appe.2002.0493. [DOI] [PubMed] [Google Scholar]
- 48.Franz MJ, VanWormer JJ, Crain AL, et al. Weight-loss outcomes: a systematic review and meta-analysis of weight-loss clinical trials with a minimum 1-year follow-up. J Am Diet Assoc. 2007;107:1755–67. doi: 10.1016/j.jada.2007.07.017. [DOI] [PubMed] [Google Scholar]
- 49.de Graaf C, Blom WA, Smeets PA, Stafleu A, Hendriks HF. Biomarkers of satiation and satiety. Am J Clin Nutr. 2004;79:946–61. doi: 10.1093/ajcn/79.6.946. [DOI] [PubMed] [Google Scholar]
- 50.Bergh C, Sjostedt S, Hellers G, Zandian M, Sodersten P. Meal size, satiety and cholecystokinin in gastrectomized humans. Physiol Behav. 2003;78:143–7. doi: 10.1016/s0031-9384(02)00958-7. [DOI] [PubMed] [Google Scholar]
- 51.Jordan H. Voluntary intragastric feeding: oral and gastric contributions to fod intake and hunger in man. Journal of Comparative and Physiological Psychology. 1969;68:498–506. doi: 10.1037/h0027664. [DOI] [PubMed] [Google Scholar]
- 52.McCutcheon NB, Tennissen AM. Hunger and appetitive factors during total parenteral nutrition. Appetite. 1989;13:129–41. doi: 10.1016/0195-6663(89)90110-4. [DOI] [PubMed] [Google Scholar]
- 53.Chapman IM, Goble EA, Wittert GA, Morley JE, Horowitz M. Effect of intravenous glucose and euglycemic insulin infusions on short-term appetite and food intake. Am J Physiol. 1998;274:R596–603. doi: 10.1152/ajpregu.1998.274.3.R596. [DOI] [PubMed] [Google Scholar]
- 54.Ludwig DS, Majzoub JA, Al-Zahrani A, Dallal GE, Blanco I, Roberts SB. High glycemic index foods, overeating, and obesity. Pediatrics. 1999;103:E26. doi: 10.1542/peds.103.3.e26. [DOI] [PubMed] [Google Scholar]
- 55.Teff K, Elliott S, Tschop M, et al. Dietary fructose reduces circulating insulin and leptin, attenuates postprandial suppression of ghrelin, and increases triglycerides in women. The Journal of Clinical Endocrinology & Metabolism. 2004;89:2963–2972. doi: 10.1210/jc.2003-031855. [DOI] [PubMed] [Google Scholar]
- 56.Di Marzo V, Bifulco M, De Petrocellis L. The endocannabinoid system and its therapeutic exploitation. Nat Rev Drug Discov. 2004;3:771–84. doi: 10.1038/nrd1495. [DOI] [PubMed] [Google Scholar]
- 57.Adami GF, Campostano A, Cella F, Scopinaro N. Serum leptin concentration in obese patients with binge eating disorder. Int J Obes Relat Metab Disord. 2002;26:1125–8. doi: 10.1038/sj.ijo.0802010. [DOI] [PubMed] [Google Scholar]
- 58.Monteleone P, Matias I, Martiadis V, De Petrocellis L, Maj M, Di Marzo V. Blood levels of the endocannabinoid anandamide are increased in anorexia nervosa and in binge-eating disorder, but not in bulimia nervosa. Neuropsychopharmacology. 2005;30:1216–21. doi: 10.1038/sj.npp.1300695. [DOI] [PubMed] [Google Scholar]
- 59.Votruba SB, Kirchner H, Tschop M, Salbe AD, Krakoff J. Morning ghrelin concentrations are not affected by short-term overfeeding and do not predict ad libitum food intake in humans. Am J Clin Nutr. 2009;89:801–6. doi: 10.3945/ajcn.2008.27011. [DOI] [PMC free article] [PubMed] [Google Scholar]
- 60.Frecka JM, Mattes RD. Possible entrainment of ghrelin to habitual meal patterns in humans. Am J Physiol Gastrointest Liver Physiol. 2008;294:G699–707. doi: 10.1152/ajpgi.00448.2007. [DOI] [PubMed] [Google Scholar]
- 61.Adolph EF, Barker JP, Hoy PA. Multiple factors in thirst. Am J Physiol. 1954;178:538–62. doi: 10.1152/ajplegacy.1954.178.3.538. [DOI] [PubMed] [Google Scholar]
- 62.Johnson AK, Thunhorst RL. Sensory mechanisms in the behavioral control of body fluid balance: thirst and salt appetite. Prog Psychobiol Physiol Psychol. 1995;16:145–76. [PubMed] [Google Scholar]
- 63.Flint A, Raben A, Blundell JE, Astrup A. Reproducibility, power and validity of visual analogue scales in assessment of appetite sensations in single test meal studies. Int J Obes Relat Metab Disord. 2000;24:38–48. doi: 10.1038/sj.ijo.0801083. [DOI] [PubMed] [Google Scholar]
- 64.Harris A, Wardle J. The feeling of hunger. Br J Clin Psychol. 1987;26(Pt 2):153–4. doi: 10.1111/j.2044-8260.1987.tb00745.x. [DOI] [PubMed] [Google Scholar]
- 65.Mattes RD, Friedman MI. Hunger. Dig Dis. 1993;11:65–77. doi: 10.1159/000171402. [DOI] [PubMed] [Google Scholar]
- 66.Phillips PA, Rolls BJ. Thirst and dehydration. In: Fiatarone-Singh, editor. Exercise, Nutrition and the Older Woman: wellness for women Over 50. CRC Press; Boca Raton: 2000. pp. 443–452. [Google Scholar]
- 67.Epstein A. Prospectus: thirst and salt appetite. In: Stricker E, editor. Neurobiology of food and fluid intake. Plenum Press; New York: 1990. pp. 489–512. [Google Scholar]
- 68.Brunstrom JM. Effects of mouth dryness on drinking behavior and beverage acceptability. Physiol Behav. 2002;76:423–9. doi: 10.1016/s0031-9384(02)00762-x. [DOI] [PubMed] [Google Scholar]
- 69.Cannon W. The physiological basis of thirst. Proc R Soc London. 1947;90:283–301. [Google Scholar]
- 70.Weigle DS, Breen PA, Matthys CC, et al. A high-protein diet induces sustained reductions in appetite, ad libitum caloric intake, and body weight despite compensatory changes in diurnal plasma leptin and ghrelin concentrations. Am J Clin Nutr. 2005;82:41–8. doi: 10.1093/ajcn.82.1.41. [DOI] [PubMed] [Google Scholar]
- 71.Bellisle F, Lucas F, Amrani R, Le Magnen J. Deprivation, palatability and the micro-structure of meals in human subjects. Appetite. 1984;5:85–94. doi: 10.1016/s0195-6663(84)80027-6. [DOI] [PubMed] [Google Scholar]
- 72.Stellar E, Shrager EE. Chews and swallows and the microstructure of eating. Am J Clin Nutr. 1985;42:973–82. doi: 10.1093/ajcn/42.5.973. [DOI] [PubMed] [Google Scholar]
- 73.Carnell S, Wardle J. Appetitive traits in children. New evidence for associations with weight and a common, obesity-associated genetic variant. Appetite. 2009;53:260–3. doi: 10.1016/j.appet.2009.07.014. [DOI] [PubMed] [Google Scholar]
- 74.Rolls BJ, Engell D, Birch LL. Serving portion size influences 5-year-old but not 3-year-old children’s food intakes. J Am Diet Assoc. 2000;100:232–4. doi: 10.1016/S0002-8223(00)00070-5. [DOI] [PubMed] [Google Scholar]
- 75.Levitsky DA, Youn T. The more food young adults are served, the more they overeat. J Nutr. 2004;134:2546–9. doi: 10.1093/jn/134.10.2546. [DOI] [PubMed] [Google Scholar]
- 76.Young LR, Nestle M. The contribution of expanding portion sizes to the US obesity epidemic. Am J Public Health. 2002;92:246–9. doi: 10.2105/ajph.92.2.246. [DOI] [PMC free article] [PubMed] [Google Scholar]
- 77.Smiciklas-Wright H, Mitchell DC, Mickle SJ, Goldman JD, Cook A. Foods commonly eaten in the United States, 1989-1991 and 1994-1996: are portion sizes changing? J Am Diet Assoc. 2003;103:41–7. doi: 10.1053/jada.2003.50000. [DOI] [PubMed] [Google Scholar]
- 78.Birch LL, Johnson SL, Andresen G, Peters JC, Schulte MC. The variability of young children’s energy intake. N Engl J Med. 1991;324:232–5. doi: 10.1056/NEJM199101243240405. [DOI] [PubMed] [Google Scholar]
- 79.Cutler D, Glaeser E, Shapiro J. Why have americans become more obese? Journal of Economic Perspectives. 2003;17:93–118. [Google Scholar]
- 80.Drummond SE, Crombie NE, Cursiter MC, Kirk TR. Evidence that eating frequency is inversely related to body weight status in male, but not female, non-obese adults reporting valid dietary intakes. Int J Obes Relat Metab Disord. 1998;22:105–12. doi: 10.1038/sj.ijo.0800552. [DOI] [PubMed] [Google Scholar]
- 81.Zizza C, Siega-Riz AM, Popkin BM. Significant increase in young adults’ snacking between 1977-1978 and 1994-1996 represents a cause for concern! Prev Med. 2001;32:303–10. doi: 10.1006/pmed.2000.0817. [DOI] [PubMed] [Google Scholar]
- 82.Forslund H, Torgerson J, Sjostrom L, Lindroos A. Snacking fequency in relation to energy intake and food choices in obese men and women compared to a reference population. Int J Obes. 2005;29:711–719. doi: 10.1038/sj.ijo.0802950. [DOI] [PubMed] [Google Scholar]
- 83.Marmonier C, Chapelot D, Louis-Sylvestre J. Effects of macronutrient content and energy density of snacks consumed in a satiety state on the onset of the next meal. Appetite. 2000;34:161–8. doi: 10.1006/appe.1999.0302. [DOI] [PubMed] [Google Scholar]
- 84.Mattes RD, Campbell WW. Effects of food form and timing of ingestion on appetite and energy intake in lean young adults and in young adults with obesity. J Am Diet Assoc. 2009;109:430–7. doi: 10.1016/j.jada.2008.11.031. [DOI] [PMC free article] [PubMed] [Google Scholar]
- 85.Irvine P, Mouzet JB, Marteau C, et al. Short-term effect of a protein load on appetite and food intake in diseased mildly undernourished elderly people. Clin Nutr. 2004;23:1146–52. doi: 10.1016/j.clnu.2004.02.011. [DOI] [PubMed] [Google Scholar]
- 86.Mattes R. Soup and satiety. Physiol Behav. 2005;83:739–47. doi: 10.1016/j.physbeh.2004.09.021. [DOI] [PubMed] [Google Scholar]
- 87.Boudville A, Bruce DG. Lack of meal intake compensation following nutritional supplements in hospitalised elderly women. Br J Nutr. 2005;93:879–84. doi: 10.1079/bjn20041359. [DOI] [PubMed] [Google Scholar]
- 88.Yeomans MR, Lartamo S, Procter EL, Lee MD, Gray RW. The actual, but not labelled, fat content of a soup preload alters short-term appetite in healthy men. Physiol Behav. 2001;73:533–40. doi: 10.1016/s0031-9384(01)00502-9. [DOI] [PubMed] [Google Scholar]
- 89.Gustafson DR, McMahon DJ, Morrey J, Nan R. Appetite is not influenced by a unique milk peptide: caseinomacropeptide (CMP) Appetite. 2001;36:157–63. doi: 10.1006/appe.2000.0392. [DOI] [PubMed] [Google Scholar]
- 90.Cecil JE, Francis J, Read NW. Comparison of the effects of a high-fat and high-carbohydrate soup delivered orally and intragastrically on gastric emptying, appetite, and eating behaviour. Physiol Behav. 1999;67:299–306. doi: 10.1016/s0031-9384(99)00069-4. [DOI] [PubMed] [Google Scholar]
- 91.Chapman IM, Goble EA, Wittert GA, Horowitz M. Effects of small-intestinal fat and carbohydrate infusions on appetite and food intake in obese and nonobese men. Am J Clin Nutr. 1999;69:6–12. doi: 10.1093/ajcn/69.1.6. [DOI] [PubMed] [Google Scholar]
- 92.Cecil JE, Castiglione K, French S, Francis J, Read NW. Effects of intragastric infusions of fat and carbohydrate on appetite ratings and food intake from a test meal. Appetite. 1998;30:65–77. doi: 10.1006/appe.1997.0109. [DOI] [PubMed] [Google Scholar]
- 93.Kaplan RJ, Greenwood CE. Influence of dietary carbohydrates and glycaemic response on subjective appetite and food intake in healthy elderly persons. Int J Food Sci Nutr. 2002;53:305–16. doi: 10.1080/09637480220138160. [DOI] [PubMed] [Google Scholar]
- 94.Holt SH, Sandona N, Brand-Miller JC. The effects of sugar-free vs sugar-rich beverages on feelings of fullness and subsequent food intake. Int J Food Sci Nutr. 2000;51:59–71. doi: 10.1080/096374800100912. [DOI] [PubMed] [Google Scholar]
- 95.Doucet E, Imbeault P, St-Pierre S, et al. Appetite after weight loss by energy restriction and a low-fat diet-exercise follow-up. Int J Obes Relat Metab Disord. 2000;24:906–14. doi: 10.1038/sj.ijo.0801251. [DOI] [PubMed] [Google Scholar]
- 96.Kovacs EM, Westerterp-Plantenga MS, Saris WH, Goossens I, Geurten P, Brouns F. The effect of addition of modified guar gum to a low-energy semisolid meal on appetite and body weight loss. Int J Obes Relat Metab Disord. 2001;25:307–15. doi: 10.1038/sj.ijo.0801546. [DOI] [PubMed] [Google Scholar]
- 97.Green SM, Blundell JE. Subjective and objective indices of the satiating effect of foods. Can people predict how filling a food will be? Eur J Clin Nutr. 1996;50:798–806. [PubMed] [Google Scholar]
- 98.Rayner CK, MacIntosh CG, Chapman IM, Morley JE, Horowitz M. Effects of age on proximal gastric motor and sensory function. Scand J Gastroenterol. 2000;35:1041–7. doi: 10.1080/003655200451153. [DOI] [PubMed] [Google Scholar]
- 99.Russell AW, Horowitz M, Ritz M, MacIntosh C, Fraser R, Chapman IM. The effect of acute hyperglycaemia on appetite and food intake in Type 1 diabetes mellitus. Diabet Med. 2001;18:718–25. doi: 10.1046/j.1464-5491.2001.00545.x. [DOI] [PubMed] [Google Scholar]
- 100.Hetherington MM, Cameron F, Wallis DJ, Pirie LM. Stimulation of appetite by alcohol. Physiol Behav. 2001;74:283–9. doi: 10.1016/s0031-9384(01)00598-4. [DOI] [PubMed] [Google Scholar]
- 101.MacIntosh CG, Sheehan J, Davani N, Morley JE, Horowitz M, Chapman IM. Effects of aging on the opioid modulation of feeding in humans. J Am Geriatr Soc. 2001;49:1518–24. doi: 10.1046/j.1532-5415.2001.4911246.x. [DOI] [PubMed] [Google Scholar]
- 102.Lavin JH, French SJ, Ruxton CH, Read NW. An investigation of the role of oro-sensory stimulation in sugar satiety? Int J Obes Relat Metab Disord. 2002;26:384–8. doi: 10.1038/sj.ijo.0801829. [DOI] [PubMed] [Google Scholar]
- 103.Yeomans MR, Phillips MF. Failure to reduce short-term appetite following alcohol is independent of beliefs about the presence of alcohol. Nutr Neurosci. 2002;5:131–9. doi: 10.1080/10284150290019008. [DOI] [PubMed] [Google Scholar]
- 104.Hall WL, Millward DJ, Long SJ, Morgan LM. Casein and whey exert different effects on plasma amino acid profiles, gastrointestinal hormone secretion and appetite. Br J Nutr. 2003;89:239–48. doi: 10.1079/BJN2002760. [DOI] [PubMed] [Google Scholar]
- 105.Gray RW, French SJ, Robinson TM, Yeomans MR. Increasing preload volume with water reduces rated appetite but not food intake in healthy men even with minimum delay between preload and test meal. Nutr Neurosci. 2003;6:29–37. doi: 10.1080/1028415021000056032. [DOI] [PubMed] [Google Scholar]
- 106.Kamphuis MM, Lejeune MP, Saris WH, Westerterp-Plantenga MS. Effect of conjugated linoleic acid supplementation after weight loss on appetite and food intake in overweight subjects. Eur J Clin Nutr. 2003;57:1268–74. doi: 10.1038/sj.ejcn.1601684. [DOI] [PubMed] [Google Scholar]
- 107.Devitt AA, Mattes RD. Effects of food unit size and energy density on intake in humans. Appetite. 2004;42:213–20. doi: 10.1016/j.appet.2003.10.003. [DOI] [PubMed] [Google Scholar]
- 108.Iyer SS, Boateng LA, Sales RL, et al. Effects of peanut oil consumption on appetite and food choice. Int J Obes (Lond) 2006;30:704–10. doi: 10.1038/sj.ijo.0803180. [DOI] [PubMed] [Google Scholar]
- 109.Norton GN, Anderson AS, Hetherington MM. Volume and variety: relative effects on food intake. Physiol Behav. 2006;87:714–22. doi: 10.1016/j.physbeh.2006.01.010. [DOI] [PubMed] [Google Scholar]
- 110.Ormerod JK, Elliott TA, Scheett TP, VanHeest JL, Armstrong LE, Maresh CM. Drinking behavior and perception of thirst in untrained women during 6 weeks of heat acclimation and outdoor training. Int J Sport Nutr Exerc Metab. 2003;13:15–28. doi: 10.1123/ijsnem.13.1.15. [DOI] [PubMed] [Google Scholar]
- 111.Mela DJ. Determinants of food choice: relationships with obesity and weight control. Obes Res. 2001;9(Suppl 4):249S–255S. doi: 10.1038/oby.2001.127. [DOI] [PubMed] [Google Scholar]
- 112.Ramsay D, Booth D. Thirst: Physiological and Psychological Aspects. Springer-Verlag; London: 1991. [Google Scholar]
- 113.Passe DH, Stofan JR, Rowe CL, Horswill CA, Murray R. Exercise condition affects hedonic responses to sodium in a sport drink. Appetite. 2009;52:561–7. doi: 10.1016/j.appet.2009.01.008. [DOI] [PubMed] [Google Scholar]
- 114.Mentes J. Oral hydration in older adults: greater awareness is needed in preventing, recognizing, and treating dehydration. Am J Nurs. 2006;106:40–9. doi: 10.1097/00000446-200606000-00023. quiz 50. [DOI] [PubMed] [Google Scholar]
- 115.Farrell MJ, Zamarripa F, Shade R, et al. Effect of aging on regional cerebral blood flow responses associated with osmotic thirst and its satiation by water drinking: a PET study. Proc Natl Acad Sci U S A. 2008;105:382–7. doi: 10.1073/pnas.0710572105. [DOI] [PMC free article] [PubMed] [Google Scholar]
- 116.Bots CP, Brand HS, Veerman EC, et al. Chewing gum and a saliva substitute alleviate thirst and xerostomia in patients on haemodialysis. Nephrol Dial Transplant. 2005;20:578–84. doi: 10.1093/ndt/gfh675. [DOI] [PubMed] [Google Scholar]
- 117.Stubbs J, Whybrow S, Mamat N. Macronutrients, feeding behavior, and weight control in humans. In: Harris R, Mattes RD, editors. Appetite and Food Intake. CRC; Boca Raton: 2009. pp. 295–322. [Google Scholar]
- 118.De Castro JM. The effects of the spontaneous ingestion of particular foods or beverages on the meal pattern and overall nutrient intake of humans. Physiol Behav. 1993;53:1133–44. doi: 10.1016/0031-9384(93)90370-u. [DOI] [PubMed] [Google Scholar]
- 119.Beridot-Therond ME, Arts I, Fantino M, De La Gueronniere V. Short-term effects of the flavour of drinks on ingestive behaviours in man. Appetite. 1998;31:67–81. doi: 10.1006/appe.1997.0153. [DOI] [PubMed] [Google Scholar]
- 120.Mattes RD. Dietary compensation by humans for supplemental energy provided as ethanol or carbohydrate in fluids. Physiol Behav. 1996;59:179–87. doi: 10.1016/0031-9384(95)02007-1. [DOI] [PubMed] [Google Scholar]
- 121.Mourao DM, Bressan J, Campbell WW, Mattes RD. Effects of food form on appetite and energy intake in lean and obese young adults. Int J Obes (Lond) 2007;31:1688–95. doi: 10.1038/sj.ijo.0803667. [DOI] [PubMed] [Google Scholar]