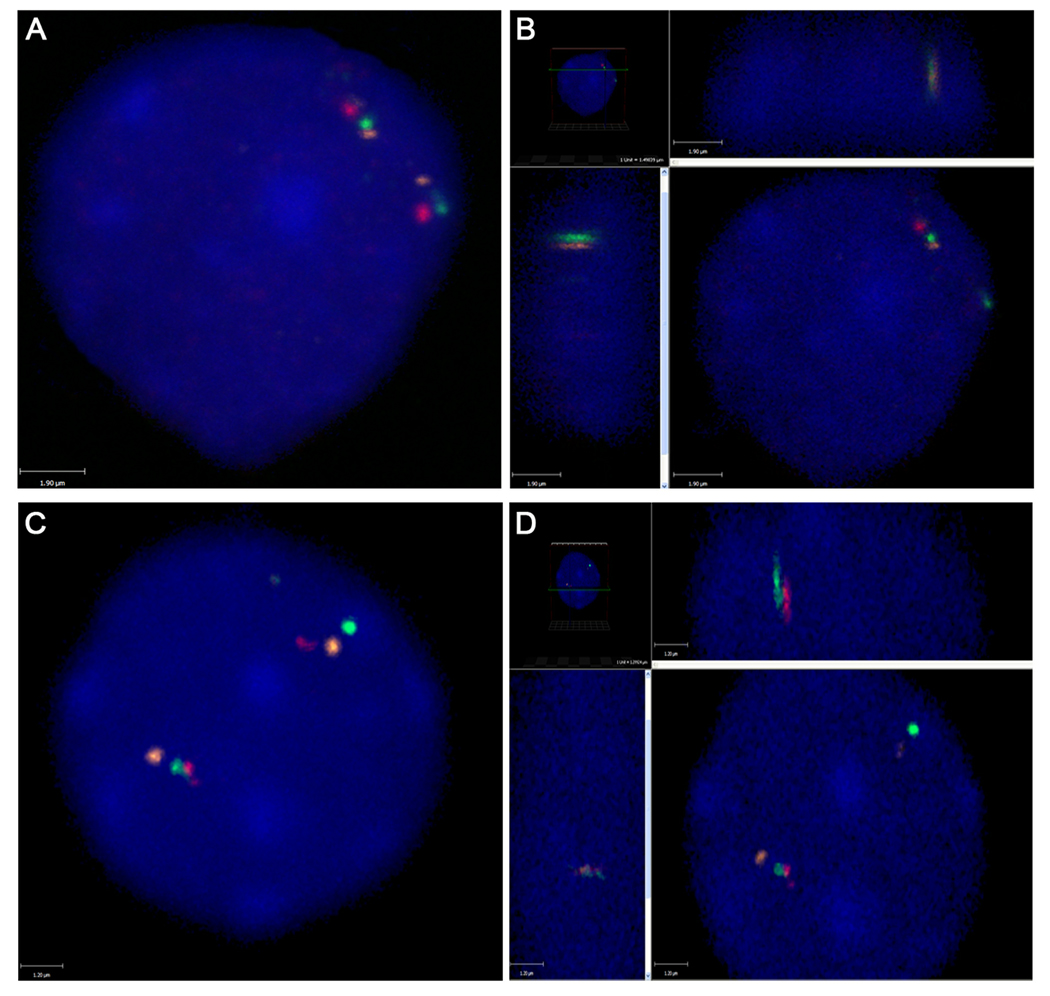
Figure 1.
Three-color fluorescence in situ hybridization (FISH) showing positioning of RET (green), NCOA4 (orange) and H4 (red) in interphase nuclei of thyroid cells. A. 2D image of a nucleus showing two sets of RET, NCOA4 and H4 with one pair of RET and NCOA4 positioned close to each other. B. 3D image showing that RET and NCOA4 are juxtaposed to each other in the same z plane. C. 2D image of a nucleus showing one pair of RET and H4 positioned close to each other. D. 3D image showing that RET and H4 are juxtaposed to each other in the same z plane.

