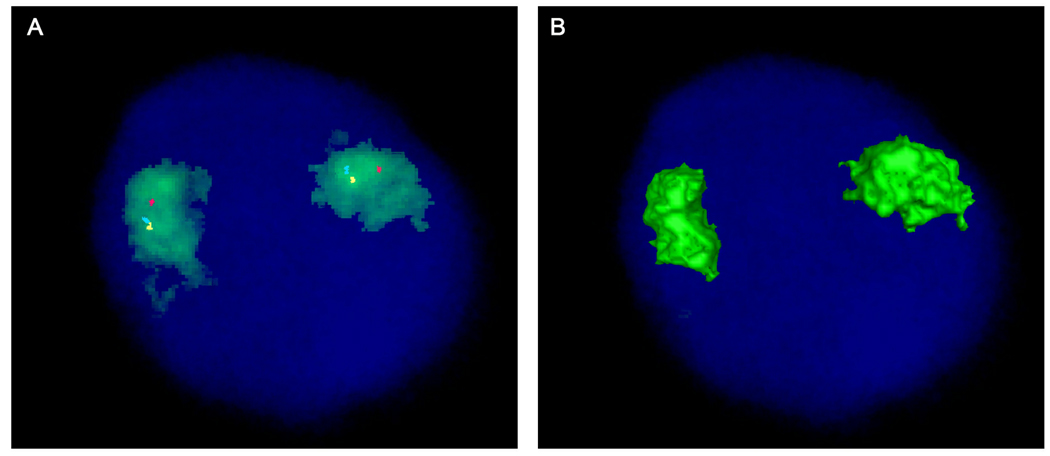
Figure 2.
Four-color FISH showing chromosome 10 territory (green) and location of RET (blue pseudocolor), NCOA4 (yellow pseudocolor) and H4 (red). A. All three genes, RET, NCOA4 and H4, are positioned within the chromosome 10 territory and away from the CT edge. B. 3D rendered image showing no signals on the surface of the CT due to the gene positioning inside the CT.

