
Fig. 5.
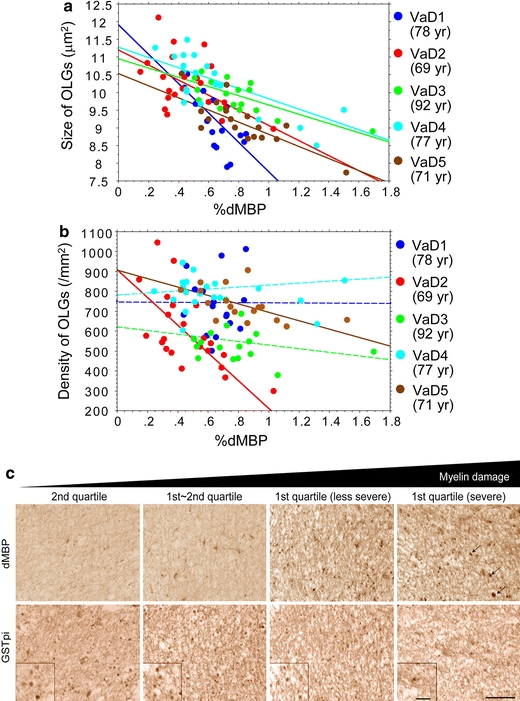
Correlation analysis between %dMBP and density/size of oligodendrocytes in the frontal lobe of VaD cases. a The %dMBP was inversely correlated with the size of oligodendrocytes (OLGs) with statistical significance (blue points, r = −0.70; red points, r = −0.48; green points, r = −0.72; light-blue points, r = −0.76; brown points, r = −0.79). Each point represents a ROI (n = 20–22) within WM per Fig. 3a. b The %dMBP inversely correlated with the density of oligodendrocytes in two VaD cases with statistical significance (red points, r = −0.64; brown points, r = −0.54) but not in the others. c Images for dMBP and GSTpi in two adjacent sections in a 78-year-old patient with VaD, showing that increased myelin damage (from left to right panels) is accompanied by shrunken oligodendrocytes. The infarcted areas with dMBP-positive macrophages (arrows) as shown in the rightmost panels were excluded from the dMBP analysis. Magnified images of GSTpi-positive oligodendrocytes are shown in insets (scale bars 50 μm)