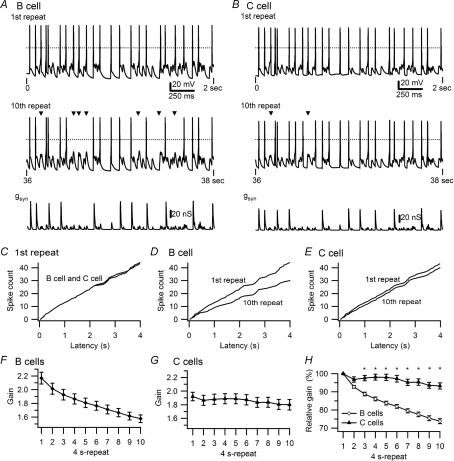
Figure 1. Differences in the activity dependence of synaptic gain in secretomotor B neurons and vasomotor C neurons.
A and B, examples of responses in a B neuron and a C neuron to virtual synaptic stimulation using the 40 s, 5 Hz stimulus template that contained 10 repetitions of a 4 s pattern. Top traces show voltage recordings during the initial 2 s of stimulation. Dashed lines indicate 0 mV. Middle traces show responses to the same stimulus 36 s later during the 10th repeat of the pattern, with missing spikes marked by triangles. The amplitude of the conductance template (lower traces) used as the command signal for the dynamic clamp was larger in the B cell (A) than the C cell (B) because the B cell had a higher threshold gsyn. C, superimposition of cumulative latency plots of spikes during the first repeat (same cells as in A and B). Cumulative latencies of spikes during the first and 10th repeats show a larger decline in the B cell (D) than the C cell (E). F, plot of synaptic gain in 47 B neurons shows a 27% decline over 40 s of 5 Hz stimulation. G, plot of synaptic gain in 21 C neurons shows a 6% decline in response to identical stimulation. H, comparison of gain in B and C neurons, normalized to responses during the first stimulus repeat reveals that the difference becomes significant (*P < 0.001) by the third 4 s repeat.

