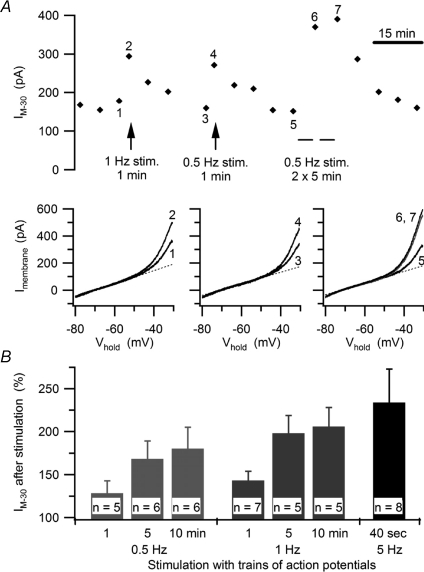
Figure 4. Physiological levels of activity enhance IM in B neurons.
A, time course of an experiment (upper panel) where increases in IM−30 were elicited by 1 Hz and 0.5 Hz trains of action potentials, which were stimulated with brief current pulses. I–V plots (lower panels) show the increases in IM produced by each stimulus train. In each plot, the curves compare currents measured just before and just after stimulation, with numerals to show corresponding trials and dashed lines denoting the extrapolated leak currents. B, summary of experiments showing graded increases in IM−30 reflect the number and frequency of action potentials.

