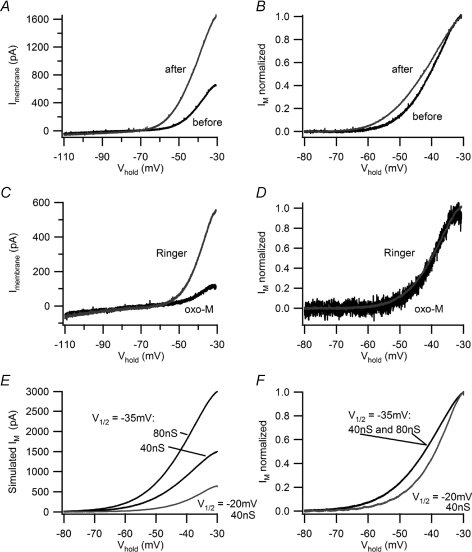
Figure 9. Activity shifts the voltage dependence of IM.
A, I–V plots measured with voltage ramps before (black) and after (grey) virtual synaptic stimulation with the 40 s, 5 Hz stimulus template show the typical increase induced by activity in B neurons. In this example, there was an approximate doubling of IM−30. B, normalized I–V plots of IM were constructed by leak subtracting the data in panel A and scaling the smaller ‘before’ current to match the ‘after’ current at −30 mV. This reveals that activity produced a hyperpolarizing shift in the I–V relation for IM. C and D, conducting the same analysis for 2.5 μm oxo-M shows that it suppressed IM in a resting B neuron by more than 50% (C) without altering its voltage dependence (D). E and F, simulating IM with the standard biophysical model (see text for details) confirms the interpretation of B cell data. E, I–V plots for simulated IM show one can double IM−30 either by doubling the maximal conductance from 40 nS to 80 nS or by shifting V1/2 from −20 mV to −35 mV. F, upon normalizing the simulated M currents, the I–V relations superimpose for 40 nS and 80 nS with V1/2=−35 mV and they are to the left of the current simulated with V1/2=−20 mV. Shifting V1/2 to the left thus reproduces the effect of activity (B) and simply lowering the maximal conductance replicates muscarinic excitation (D).

