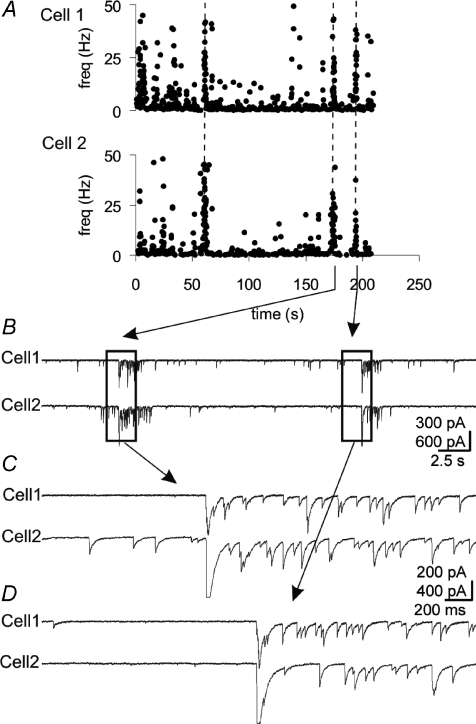
Figure 8. Synchronized bursts of IPSCs in pairs of MNCs.
A, running histogram of frequency of IPSCs recorded simultaneously in 2 cells, spaced ∼100 μm apart, at −60 mV with high [Cl−] patch solution. Vertical dashed lines denote synchronized bursts. B, raw traces for portion of histogram in A, containing the last 2 episodes of synchronized bursts. C and D, expanded views of the left and right boxed areas in B, respectively.

