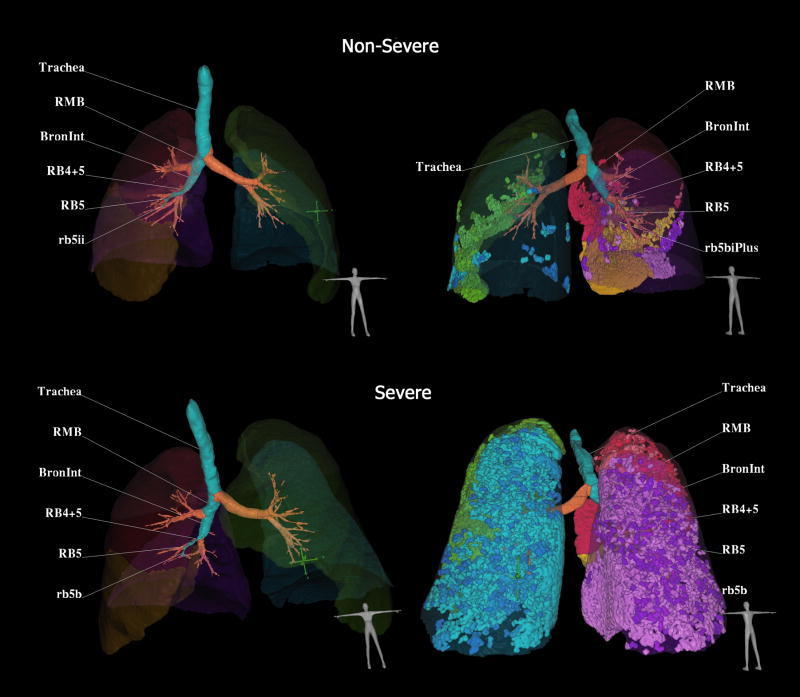
Figure 1.
CT-derived three-dimension display of the lungs, airways and regions of air trapping. Example comparison of two asthmatic subjects falling in the non-severe (upper row) or severe (lower row) categories. In the left column, the lung lobes and airway tree are shown from a ventral view. In the right column, the air trapping is depicted, color coded by lobe and displayed from the dorsal aspect. Software allows one to click on an airway path of interest and airway segment labels are automatically generated. Trapped air defined as voxels within the lung field falling below −850 are highlighted and coded by lobe in the left column. The severe asthma subject has 21.0% of lung less than −850 HU as compared to the non-severe asthma subject with 4.75% of lung less than −850 HU. Images from Pulmonary Workstation 2.0 (Vida Diagnostics, Coralville, Iowa)

