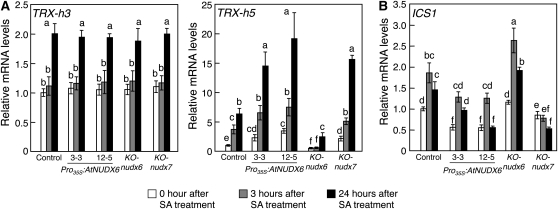
Figure 7.
Changes in the expression of TRXs and ICS1 by disruption or overexpression of AtNUDX6 under SA treatment. Experimental conditions are the same as in Figure 4. Quantitative PCR analysis was performed to determine the expression levels of genes encoding TRXs (TRX-h3 and TRX-h5 [A]) and ICS1 (B) in the control, KO-nudx6, Pro35S:AtNUDX6, and KO-nudx7 plants. The relative amounts were normalized to Actin2 mRNA. Basal levels in the control plants under normal conditions were set at 1.0, and results are expressed as fold increase over the control levels. Data are means ± sd for three individual experiments (n = 3) using plants grown independently. Different letters indicate significant differences (P < 0.05).

