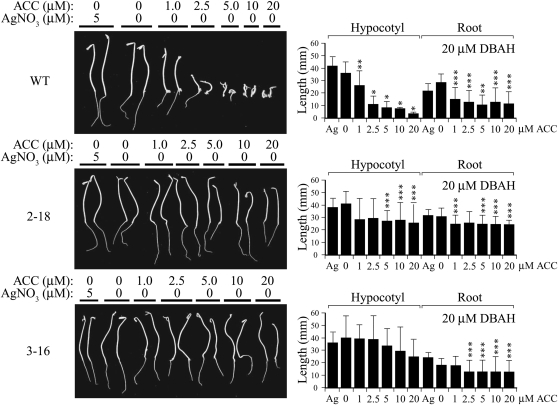
Figure 6.
Induction of etr1-1 expression confers ethylene insensitivity over a range of ACC concentrations. Seeds of line 2-18 (containing p1002) and line 3-16 (containing p1003) were germinated on 20 μm DBAH and either 5 μm AgNO3 or ACC at the concentrations indicated and grown in the dark for 14 d. Wild-type seeds (WT) were included as a negative control. Two representative seedlings are shown for each line. Quantitative measurements for hypocotyl and root lengths with sd are shown in the histograms to the right of each panel. Ten to 20 seedlings were used for each measurement. The P values represent the statistical significance between each starred bar relative to growth on 5 μm AgNO3: * P < 0.001, ** P < 0.005, *** P < 0.05.

