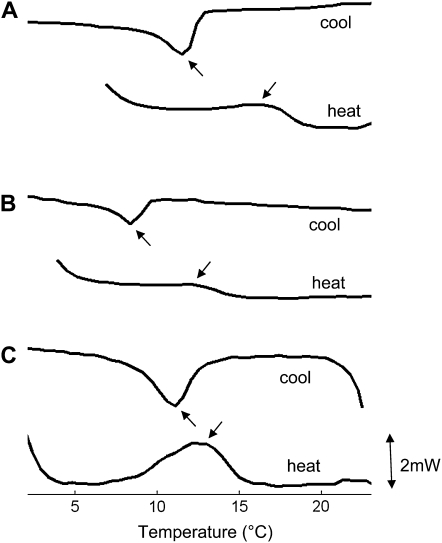
Figure 3.
Typical DSC thermograms of lipid suspensions. A, POPE:POPC:POPS. B, MDA-POPE:POPC:POPS. C, POPS. Arrows identify melting (Tm) and crystallization (Tc) transitions. Curves are averages over three repeated heating or cooling steps (10°C min−1). The vertical (excess heat) scale is constant throughout. Measured transition temperatures are as follows: POPE:POPC:POPS, Tm = 16°C ± 2°C, Tc = 11.5°C ± 1°C; MDA-POPE:POPC:POPS, Tm = 12°C ± 2°C, Tc = 8.5°C ± 1°C; POPS, Tm = 13°C ± 1°C, Tc = 11°C ± 1°C; POPE, Tm = 23°C ± 2°C, Tc = 19.5°C ± 1°C; MDA-POPE, Tm = 13°C ± 2°C, Tc = 6°C ± 2°C. Measured values of Tm for POPE and POPS are approximately 1°C below the main fluid gel transition temperatures in the literature (Silvius, 1982), so Tm is taken as a proxy for this transition. Tc is dependent on the scanning rate, falling by approximately 1°C at 20°C min−1 (data not shown), consistent with Lewis et al. (2007). Lipid mixtures have weaker and broader peaks than pure lipids. MDA-POPE behaves more like a lipid mixture, probably due to by-products of the lipid/MDA reaction (Balasubramanian et al., 2001). DSC thermograms were obtained with a Perkins-Elmer Pyrus I heat conduction machine. The protocol followed Borochov et al. (1994): lipids (2 mg) were deposited directly onto DSC pans in chloroform solution, and solvent was removed under nitrogen, before resuspension in buffer (30 mL, 1 mm CaCl2, pH 6). The sample was equilibrated for 2 h at 50°C before scanning against buffer alone.

