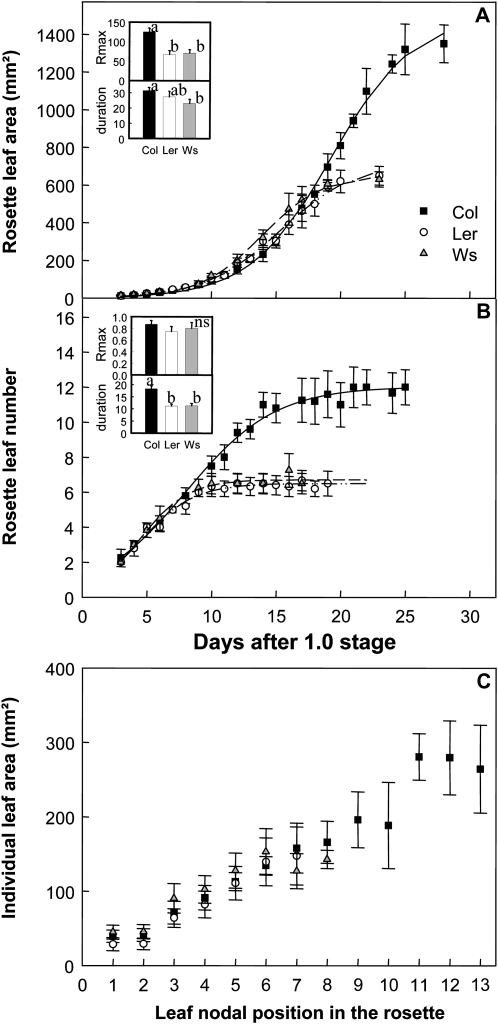
Figure 1.
Macroscopic kinematic leaf growth phenotypes. A, Changes with time of RA. B, Changes with time of rosette LN. C, Individual final leaf area according to leaf nodal position in the rosette. The increase of RA and rosette LN is described by y = A/[1 + e (−(X−X0)/B)]. The inset in A shows mean and sd values of maximal rate and duration of rosette leaf expansion (Rmax in mm2 d−1 and duration in d), and the inset in B shows mean and sd values of maximal rate and duration of leaf production (Rmax in leaf no. d−1 and duration in d). Lowercase letters indicate significant differences (P < 0.05). ns, No significant difference.

