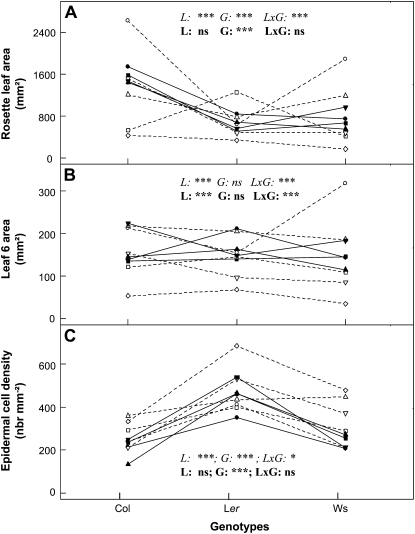
Figure 4.
Phenotype ranking per genotype across laboratories. Mean values of RA (A), sixth leaf area (B), and epidermal CD in the sixth leaf (C) calculated per genotype and per laboratory are shown. L1, White circles; L2, black circles; L3, black squares; L4, white squares; L5, white diamonds; L6, white lower triangles; L7, white upper triangles; L8, black upper triangles; L9 black lower triangles. The core laboratories (L2, L3, L8, and L9) are represented by black symbols and straight lines and the others with white symbols and dashed lines. For each variable, ANOVA was performed either on the data including all nine laboratories (italics) or the core laboratories (boldface) to evaluate laboratory (L), genotype (G), and interaction (L×G) effects. Asterisks indicate significant differences (*** P < 0.001, * P < 0.05), and ns indicates the absence of a significant difference.

