Figure 5.
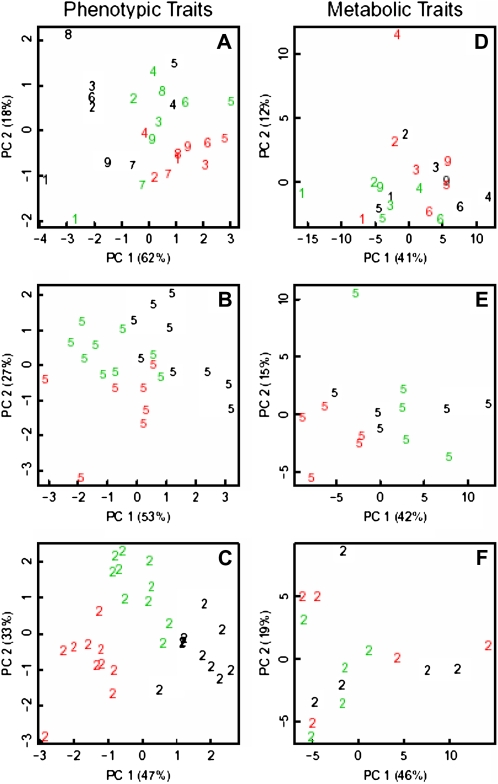
PCA of leaf growth variables (rosette LN, RA, AL6, epidermal CD in leaf 6, and mean epidermal CA in leaf 6; A–C) and metabolic profiles (D–F). Graphs represent data averaged from all laboratories (A and D) or individual replicates from L5 (B and E) and L2 (C and F). Colors indicate the genotype: Col, black; Ler, red; Ws, green. Numbers identify laboratories.

