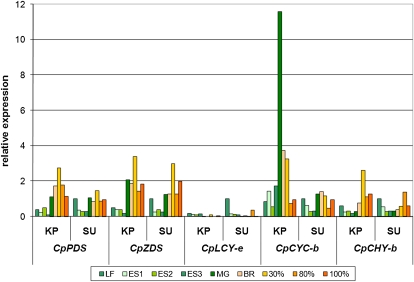
Figure 3.
Differential expression of carotenoid biosynthesis genes in developing and ripening papaya fruit. Data are normalized to actin gene expression in SunUp leaf tissue. KP, Kapoho; SU, SunUp; LF, leaf; ES, expansion size; MG, mature green; BR, breaker. Fruit ripeness stages are listed as percentages (30%, 80%, and 100%).

