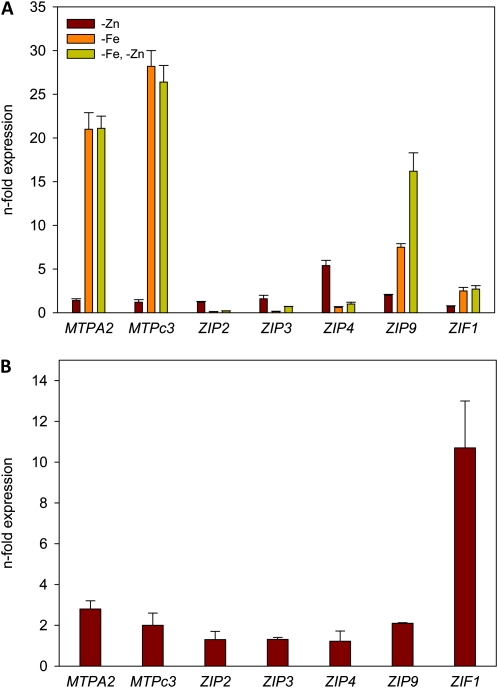
Figure 5.
Expression patterns of transition metal transporters. Transcript levels were determined by real-time RT-PCR in plants that were grown on media deprived of Zn, Fe, or both nutrients for 3 d (A) or in the presence of Fe and a surplus of 10 μm Zn (B). Data are expressed as ΔΔCT. All data are presented as means from three independent biological replicates, and error bars represent se. [See online article for color version of this figure.]

