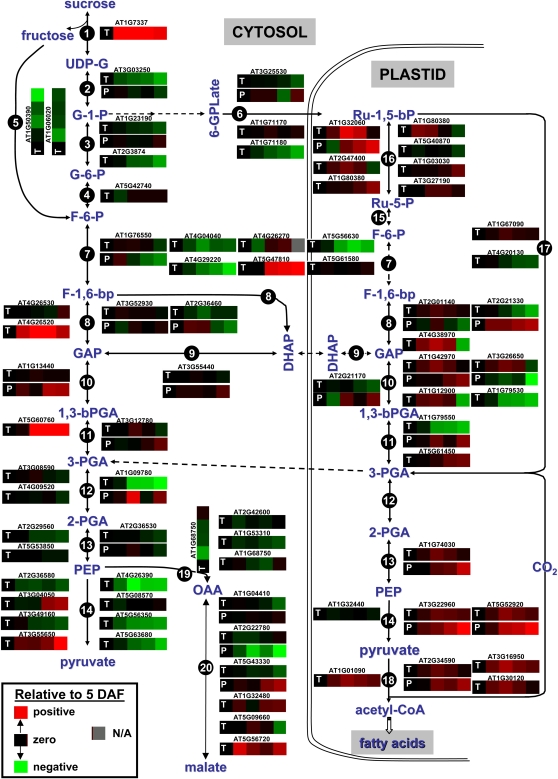
Figure 4.
Schematic view of carbohydrate metabolism during seed filling of Arabidopsis. Expression (heat) maps of individual protein (P) and transcript (T) expression based on proteomics and microarray experiments as relative value to 5 DAF are shown. Protein/transcript pairs are under one ATG number. Intermediates: UDP-G, UDP-Glc; G-1-P, Glc-1-P; G-6-P, Glc-6-P; F-6-P, Fru-6-P; 6PGLone, 6-phosphoglucono-d-lactone; 6PGLate, 6-phosphogluconate; Ru-5-P, ribulose-5-P; GAP, glyceraldehyde-3-P; F-1,6-bp, Fru-1,6-bisP; DHAP, dihydroxyacetone phosphate. Enzymes: 1, Suc synthase; 2, UDP-Glc pyrophosphorylase; 3, phosphoglucomutase; 4, Glc-6-P isomerase; 5, fructokinase; 6, phosphoglucomutase + Glc-6-P dehydrogenase + 6-phosphogluconate dehydrogenase + phosphoribulokinase; 7, phosphofructokinase; 8, Fru-1,6-bisP aldolase; 9, triose-P isomerase; 10, glyceraldehyde-3-P dehydrogenase; 11, phosphoglycerate kinase; 12, 2,3-bisphosphoglycerate-independent phosphoglycerate mutase; 13, enolase; 14, pyruvate kinase; 15, Glc-6-P isomerase + Glc-6-P dehydrogenase + 6-phosphogluconate dehydrogenase; 16, phosphoribulokinase; 17, Rubisco; 18, pyruvate dehydrogenase; 19, phosphoenolpyruvate carboxylase; 20, malate dehydrogenase.

