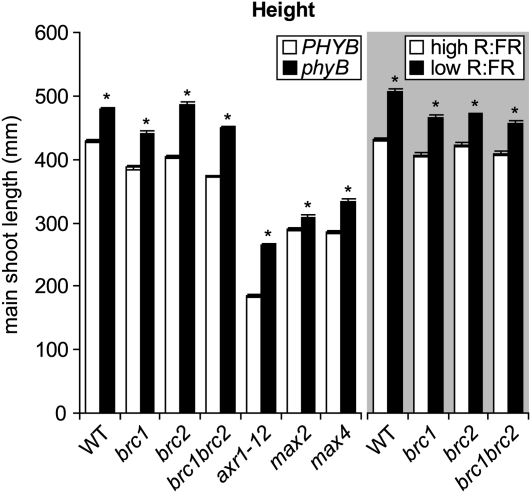
Figure 4.
Overall height of the main shoot of various Arabidopsis genotypes at 10 DPA with or without functional phyB (left panel of the graph) or under high and low R:FR (shaded right panel of the graph). Statistical comparisons were made within each genotype sufficient (PHYB) or deficient (phyB) for phyB or within each genotype grown under high versus low R:FR. Asterisks indicate significant differences between genotypes or light treatments at α = 0.05. Data are means ± se. For analyses comparing lines with or without functional phyB, n = 28 (phyBmax2) to 87 (wild type [WT]), average n = 51. For high and low R:FR, n = 26 (brc1) to 70 (wild type), average n = 37.

